

By-
Dr Arihant Jain, MD | lifeonthefrontline.com
Instagram: @humans.of.em
X | Linkedin | ORCID
————————————————————————
You look at the ABG:
pH 7.20
PaCO₂ 40 mmHg
HCO₃⁻ 15 mmol/L
The diagnosis seems straightforward:
Metabolic acidosis.
But then comes the more important question:
Why is the bicarbonate low?
Is it lactate?
Too much chloride?
Hypoalbuminemia masking the acidosis?
Renal dysfunction?
Ketones?
Unmeasured anions?
Or a combination of several processes occurring simultaneously?
This is where the Stewart approach becomes useful. Not because the traditional Henderson–Hasselbalch approach is wrong.
But because sometimes:
Henderson–Hasselbalch tells you what is happening. Stewart helps you understand what is driving it.

Don’t throw away the traditional ABG approach
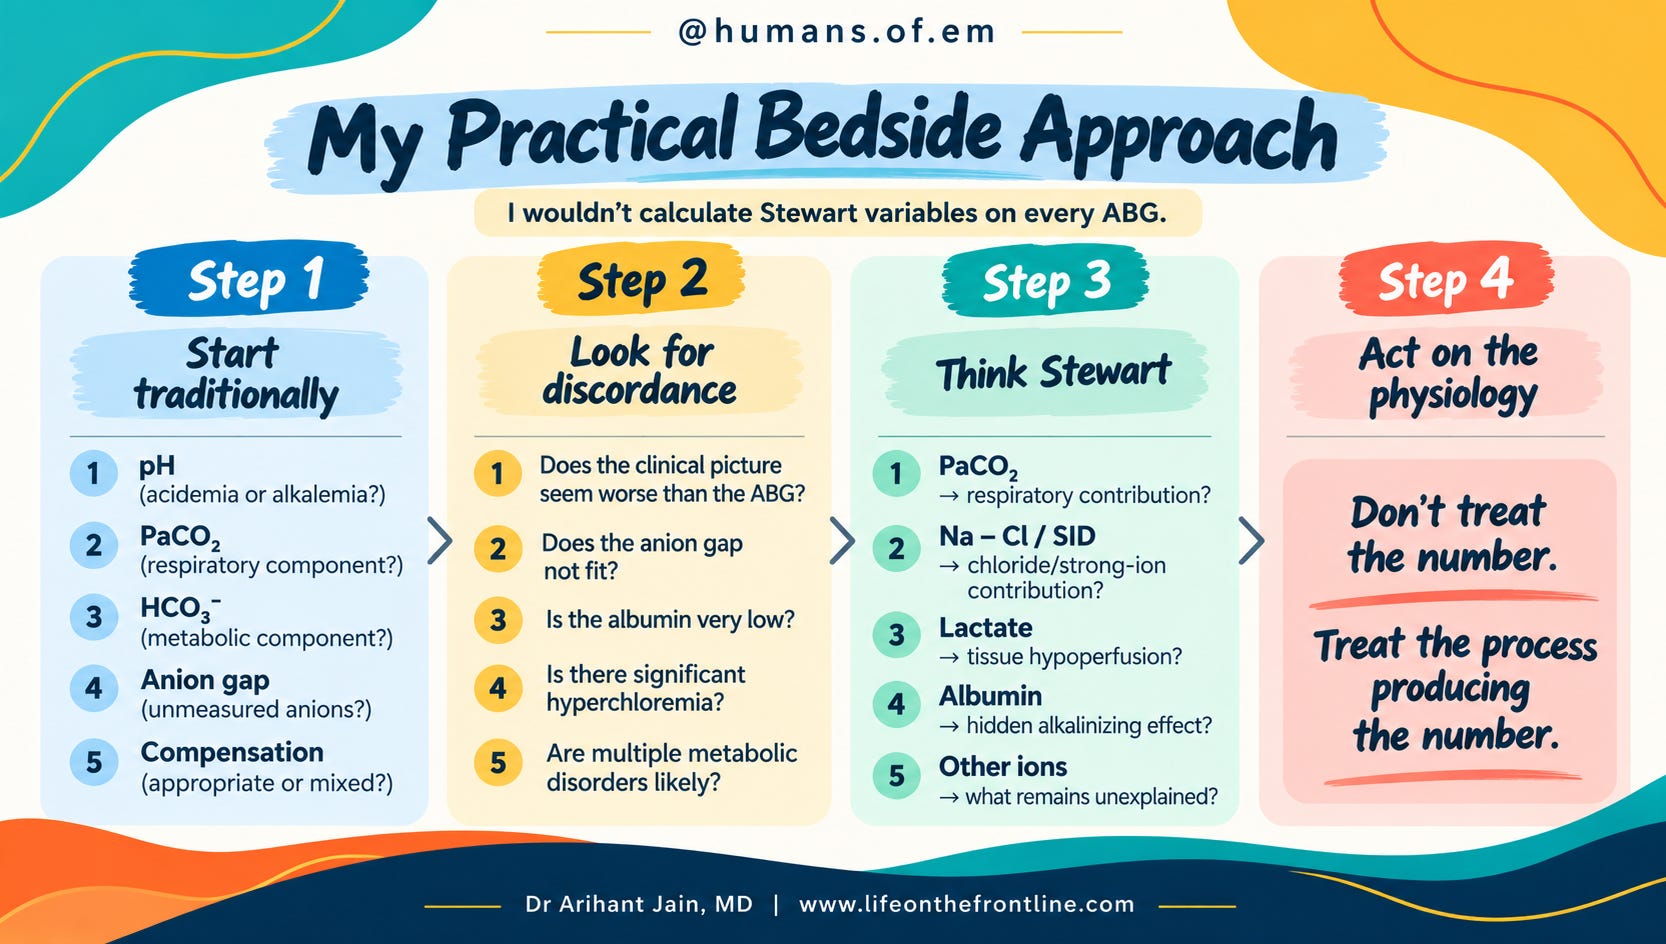
For most patients in the ED, start conventionally as we discussed in the previous post ABG Series #4
pH → PaCO₂ → HCO₃⁻ → anion gap → compensation → clinical context
This is fast, familiar and clinically useful.
The problem arises when the patient has multiple simultaneous processes.
A critically ill patient may have:
lactic acidosis from shock
hyperchloremia from saline
hypoalbuminemia
renal dysfunction
unmeasured anions
and a respiratory disorder
…and these processes can partially cancel each other out. The ABG may therefore look deceptively simple. This is exactly where a quantitative approach can add another layer of understanding.
The Stewart idea: What actually determines pH?
Stewart’s approach starts with a different question. Instead of treating bicarbonate and hydrogen ions as independent causes of acid–base disturbance, it considers three major independent variables:
1️⃣ PaCO₂
The respiratory component.
2️⃣ Strong Ion Difference — SID
The difference between fully dissociated cations and anions.
3️⃣ Total concentration of weak acids — Aₜₒₜ
Primarily albumin and phosphate in plasma.
In the full Stewart model, these variables interact through the principles of mass conservation, electrical neutrality and chemical equilibrium. As Story explains, H⁺ and HCO₃⁻ are dependent variables in this framework; their concentrations are determined by PaCO₂, SID and Aₜₒₜ. (Story, 2016). modified abg (1)(4)
That sounds intimidating. Fortunately, you don’t need six simultaneous equations to use the concept at the bedside.
The Physician-friendly version
David Story proposed a simplified bedside approach that translates the Stewart concept into something much more practical. (Story, 2016).
The idea is to deconstruct the base excess (BE) into clinically recognizable components. Think of BE as the net metabolic effect.
Then ask:
What is making the patient acidotic, and what is simultaneously pushing the pH in the opposite direction?
Story’s simplified approach breaks this into:
1. Na⁺–Cl⁻ effect
2. Lactate effect
3. Albumin effect
4. Other ions* - most important component
And together:
BE = Na–Cl effect + Lactate effect + Albumin effect + Other ions
Let me explain simply
Total metabolic component = NAGMA + HAGMA + Met. Alkalosis
Total Metabolic component = Base Excess
NAGMA plus Met. Alkalosis = Na- Cl Component - SID
HAGMA = lactate plus ketones plus urea and other unmeasured causes
and Albumin effect
1. The Na⁺–Cl⁻ component
This is one of the most clinically useful Stewart concepts in the ED. For the simplified bedside calculation:
NAGMA and Metabolic alkalosis component = (Na − Cl) − 35
Na - Cl > 35 - Met alkalosis
Na- Cl < 35 - NAGMA
The reference Na−Cl difference is approximately 35 mEq/L.
If the difference becomes smaller, the effect is acidifying.
Example
Na = 140
Cl = 115
Na − Cl = 25
Therefore:
25 − 35 = −10 mEq/L
That’s a substantial acidifying effect. And this is where the familiar ED scenario becomes relevant:
Large-volume normal saline.
Normal saline contains a relatively high chloride concentration. As chloride accumulates, the Na−Cl difference narrows → SID decreases → metabolic acidosis develops.
This is the physiological basis behind hyperchloremic metabolic acidosis.
The clinical example also highlights how fluid choice can influence this component: a lower-chloride fluid would be expected to widen the Na−Cl difference and reduce this acidifying effect.
So instead of simply saying:
“The patient has NAGMA.”
Stewart lets you ask:
“Is chloride actually driving part of this acidosis?”
That’s a much more actionable question.
2. Lactate
The next component is easier.
Lactate effect = 1 − measured lactate
with 1 mmol/L as the reference value.
So if lactate = 5:
1 − 5 = −4 mEq/L
That’s an acidifying effect. This immediately links the physiology to the clinical picture:
Shock → tissue hypoperfusion → increased lactate → increased strong anion burden → metabolic acidosis.
But here’s an important point:
Lactate may not explain the entire acidosis.
A patient with lactate 5 may have:
lactate-driven acidosis
hyperchloremic acidosis
hypoalbuminemic alkalinization
and another unidentified acidifying process
all at the same time. And that’s where the next component becomes important.
3. Albumin: the hidden alkalinizer
This is probably one of the most clinically useful lessons from the Stewart framework. Albumin is a weak acid. Therefore:
Lower albumin → less weak acid → alkalinizing effect.
Story’s simplified calculation is:
Albumin effect = 0.25 × (42 − albumin in g/L)
with 42 g/L as the reference albumin concentration.
For example:
Albumin = 22 g/L
0.25 × (42 − 22)
= +5 mEq/L approximately
That’s an alkalinizing effect. And this matters enormously in critically ill patients. Because a patient can simultaneously have:
Lactic acidosis + hyperchloremia while hypoalbuminemia is partially masking the severity of the metabolic acidosis.
So a “not too bad” pH does not necessarily mean a mild metabolic disturbance. The patient may have several opposing processes.
4. And then comes the most interesting component:
“Other ions”
This is where Stewart becomes particularly interesting clinically.
After accounting for:
Na–Cl
lactate
albumin
there may still be an unexplained component of the base excess. Story refers to this as other ions, encompassing measured and unmeasured cations and anions. Ketoacids, Phosphate, sulfate and other unmeasured ions may become particularly relevant in organ dysfunction.
You can calculate it as a residual:
Other ions = BE − (Na–Cl effect + lactate effect + albumin effect)
And this is where the calculation can become a clinical clue.
What if “Other ions” is −6?
Imagine:
Other ions = −6 mEq/L
after accounting for lactate and albumin.
That means:
Your currently identified causes don’t completely explain the metabolic acidosis.
And this is the key clinical interpretation:
The “other ions” component doesn’t tell you what the diagnosis is. It tells you that your current explanation is incomplete.
Now broaden the differential.
Could there be significant renal dysfunction with retention of acidifying ions such as urate, sulfate, phosphate and other organic anions?
Could there be ketones?
Could there be another unmeasured anion?
And if those explanations don’t fit, particularly in the right clinical context, could this represent a toxic ingestion?
For example:
methanol
ethylene glycol
other toxic causes of high-anion-gap metabolic acidosis
The ED may not immediately have access to every specific toxin assay. But the physiology can tell you:
“There is something here that I haven’t accounted for.”
That should trigger targeted investigation rather than premature closure. And importantly, a negative “other ions” residual does not diagnose a toxin. It is a signal to reconsider the differential using the history, renal function, ketones, lactate, anion/osmolal gaps and clinical context.
Let’s put everything together
A worked example makes this much easier to understand.
Patient:
Na⁺ = 133 mmol/L
Cl⁻ = 110 mmol/L
Albumin = 22 g/L
Lactate = 5 mmol/L
pH = 7.20
PaCO₂ = 40 mmHg
HCO₃⁻ = 15 mmol/L
BE = −11.5 mmol/L
At first glance:
Metabolic acidosis.
But Stewart asks:
What all is contributing to that BE = − 11.5?
a. Na–Cl ( sum of NAGMA plus Met. Alkalosis component)
(133 − 110) − 35 = −12 mEq/L
Strong acidifying effect.
b. Lactate
1 − 5 = −4 mEq/L
Another acidifying effect.
c. Albumin
0.25 × (42 − 22) = +5.5 mEq/L
An alkalinizing effect.
d. Other ions
We already know:
BE = −11.5
So:
Other ions = −11.5 − [−12 + (−4) + 5.5] = approximately −1 mEq/L
Put everything together:
BE = −12 − 4 + 5.5 − 1
BE ≈ −11.5 mEq/L
Exactly matching the measured BE.
Now the ABG is no longer simply:
“Metabolic acidosis.”
We can tell a much richer story:
Hyperchloremic/low Na–Cl contribution
lactic acidosis
hypoalbuminemic alkalinization
small residual other-ion effect
And there is another important observation.
With HCO₃⁻ around 15 mmol/L, expected PaCO₂ by Winter’s formula would be approximately 30–32 mmHg.
But PaCO₂ is 40 mmHg.
So this patient also has a respiratory acidosis.
Now the physiology starts making sense:
Multiple disorders are occurring simultaneously—and some are masking others.
Why does this matter in the ED and acute care?
Because ED patients rarely arrive with a single textbook disorder. Consider the septic patient who has:
Lactate ↑
Normal saline resuscitation
Albumin ↓
AKI developing
Possible ketosis
Respiratory fatigue
The traditional approach may tell you:
“Mixed metabolic acidosis.”
Useful - but incomplete. The Stewart lens asks:
Which processes are actually pushing the pH in each direction?
That distinction matters because the answer may influence what you do next.
If chloride is the problem:
Think about ongoing chloride-rich fluid exposure.
If lactate dominates:
Treat the underlying perfusion problem.
If hypoalbuminemia is substantial:
Recognize that it may be masking part of the metabolic acidosis.
If renal dysfunction is present:
Think beyond urea alone—the acidifying effect is related to retention of sulfate, phosphate and other acids/anions.
If a significant unexplained residual remains:
Look for ketones, unmeasured anions and—when clinically appropriate—toxic causes.
The point isn’t to calculate numbers for the sake of calculation.
The point is to connect the ABG to the patient’s physiology.
Why is it particularly relevant in acute care?
Because acute-care medicine is full of rapidly changing iatrogenic physiology. The patient’s acid–base status is not static. Fluids change chloride. Blood products and medications alter the ionic environment. Resuscitation changes lactate. Renal function evolves. Albumin changes. Ventilation changes PaCO₂.
And the patient may move from one dominant process to another within hours.
Story specifically emphasizes that the simplified Stewart approach can help understand the patient’s current acid–base status and anticipate the acid–base consequences of future fluids and therapies. modified abg (1)(4)
That makes it particularly relevant to:
Resuscitation → ICU transfer → ventilation → renal replacement → ongoing fluid therapy
rather than being merely an academic alternative to Henderson–Hasselbalch.
But is Stewart better than the traditional approach?
This is where we need to be honest.
Not necessarily.
The Stewart approach provides a mechanistic framework and can make complex mixed disorders easier to understand.
But it is more cumbersome. Studies comparing Stewart-based approaches with traditional methods have often found that much of the additional information can also be obtained using albumin-corrected anion gap and conventional acid–base analysis.
Rastegar (2009), for example, concluded that Stewart’s method offers a mechanistic explanation but did not demonstrate clear superiority in diagnostic, management or prognostic performance over traditional approaches.
More recent work continues to support a pragmatic position: conventional approaches work well for many patients, while a simplified Stewart approach becomes particularly useful when multiple metabolic processes coexist or appear to be offsetting each other.
So the message isn’t:
❌ “Forget Henderson–Hasselbalch.”
It is:
✅ “Know when the traditional framework isn’t telling you enough.”
The take-home message
Stewart can initially feel unnecessarily complicated.
But at the bedside, its most useful lesson is actually quite simple:
Acid–base disorders are often not one problem. They are several processes happening simultaneously.
A patient can be:
acidotic from chloride
acidotic from lactate
acidotic from unmeasured ions
while being
alkalotic from hypoalbuminemia
—all at the same time.
And the final pH is simply the result of those competing forces.
So remember:
—> Henderson–Hasselbach tells you WHAT is happening.
—> Base excess tells you the NET metabolic effect.
—> Stewart helps you understand WHAT is DRIVING that effect.
And perhaps the most useful lesson of all:
When the “other ions” component is abnormal, don’t immediately ask, “What toxin is this?”
Ask, “What have I not explained yet?”
Because in acute care, an unexplained residual is often more valuable than a falsely reassuring explanation.
Preferred Reads -
Story DA. Stewart acid-base: a simplified bedside approach. Anesth Analg. 2016;123(3):511-515. doi:10.1213/ANE.0000000000001261
Rastegar A. Clinical utility of Stewart’s method in diagnosis and management of acid-base disorders. Clin J Am Soc Nephrol. 2009;4(7):1267-1274. doi:10.2215/CJN.01870309
Duška F, Krbec M, Heldeweg M, Elbers PWG, Giosa L. A pragmatic approach to complex acid base disturbances of critical illness: the “Stewart light.” Intensive Care Med. 2026;52(6):1322-1325. doi:10.1007/s00134-026-08416-3.