
The Ventilator Screen Decoded : Part 1
How to read pressure, flow, and volume waveforms to diagnose lung mechanics, patient–ventilator asynchrony, and hidden problems at the bedside.

Most clinicians focus on numbers on the ventilator:
Tidal volume
Respiratory rate
PEEP
FiO₂
But the real story is told by the ventilator waveforms.
Pressure, flow, and volume curves show the interaction between the patient and the ventilator in real time. Learning to read them allows clinicians to detect problems such as:
Airway obstruction
Poor lung compliance
Auto-PEEP
Ventilator asynchrony
Often before the patient deteriorates clinically.
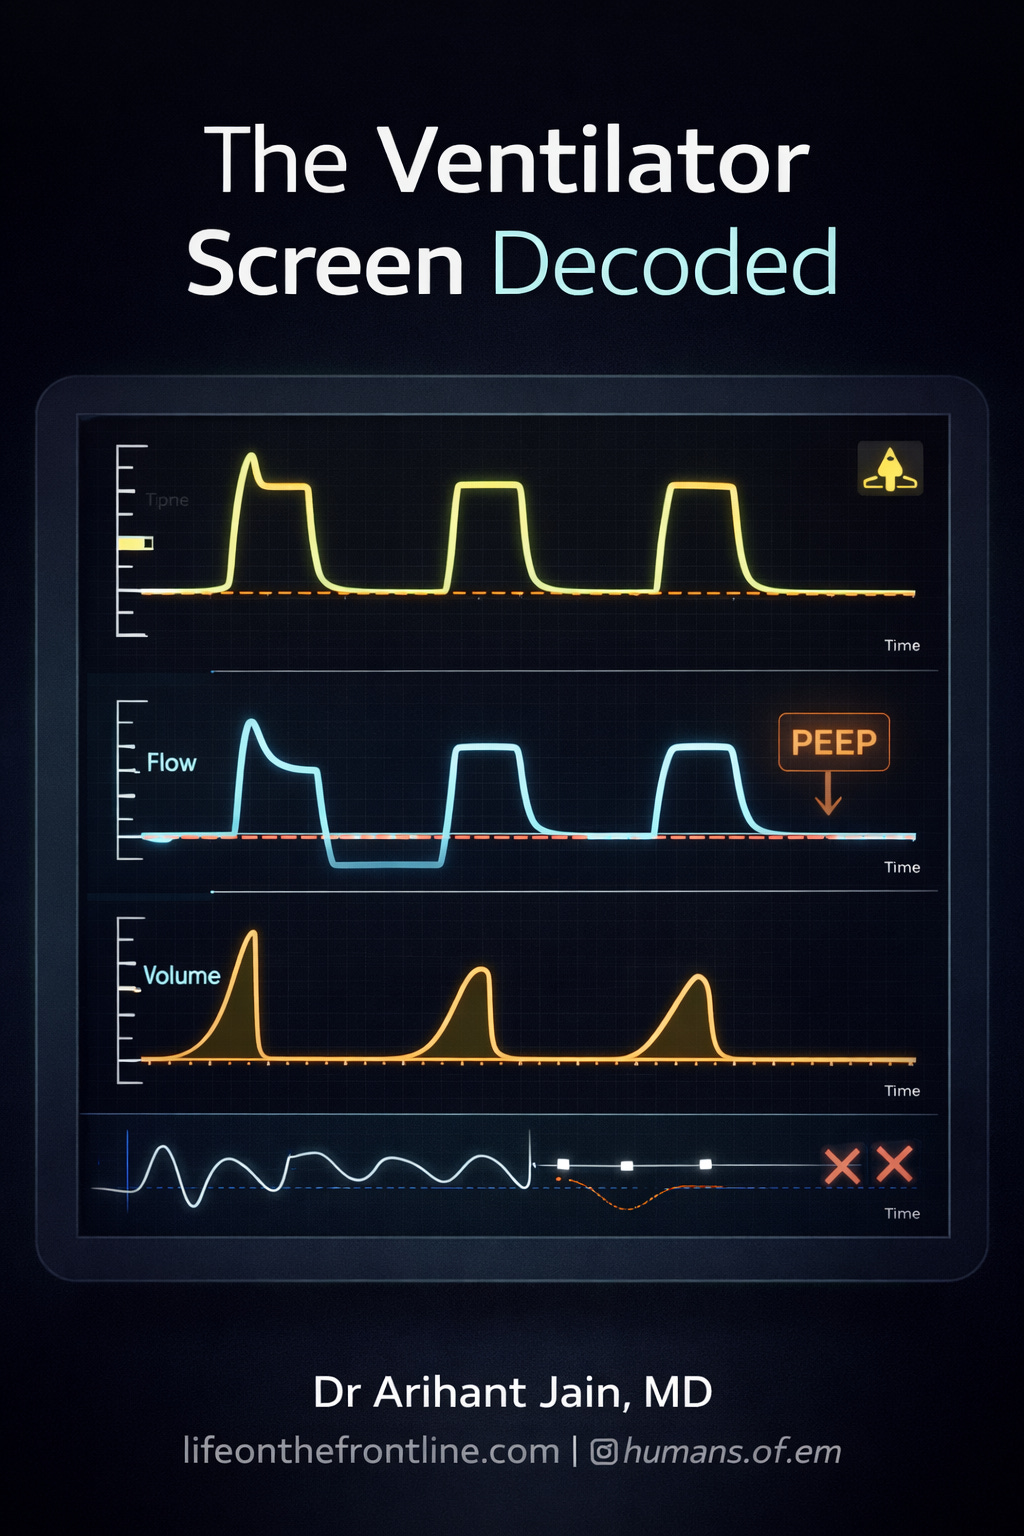
The Three Fundamental Waveforms
Every ventilator screen shows three basic scalars:
Pressure vs time
Flow vs time
Volume vs time
These waveforms display how gas moves into and out of the lungs with every breath. Ventilators directly measure airway pressure and flow, while volume is derived from the flow signal
1. The Flow–Time Waveform
The Most Informative Curve
The flow waveform represents how quickly gas moves into and out of the lungs.
Two phases exist in every breath:
Inspiratory phase
Active
Controlled by ventilator settings
Pattern depends on ventilation mode
Expiratory phase
Passive
Determined by lung recoil and airway resistance.
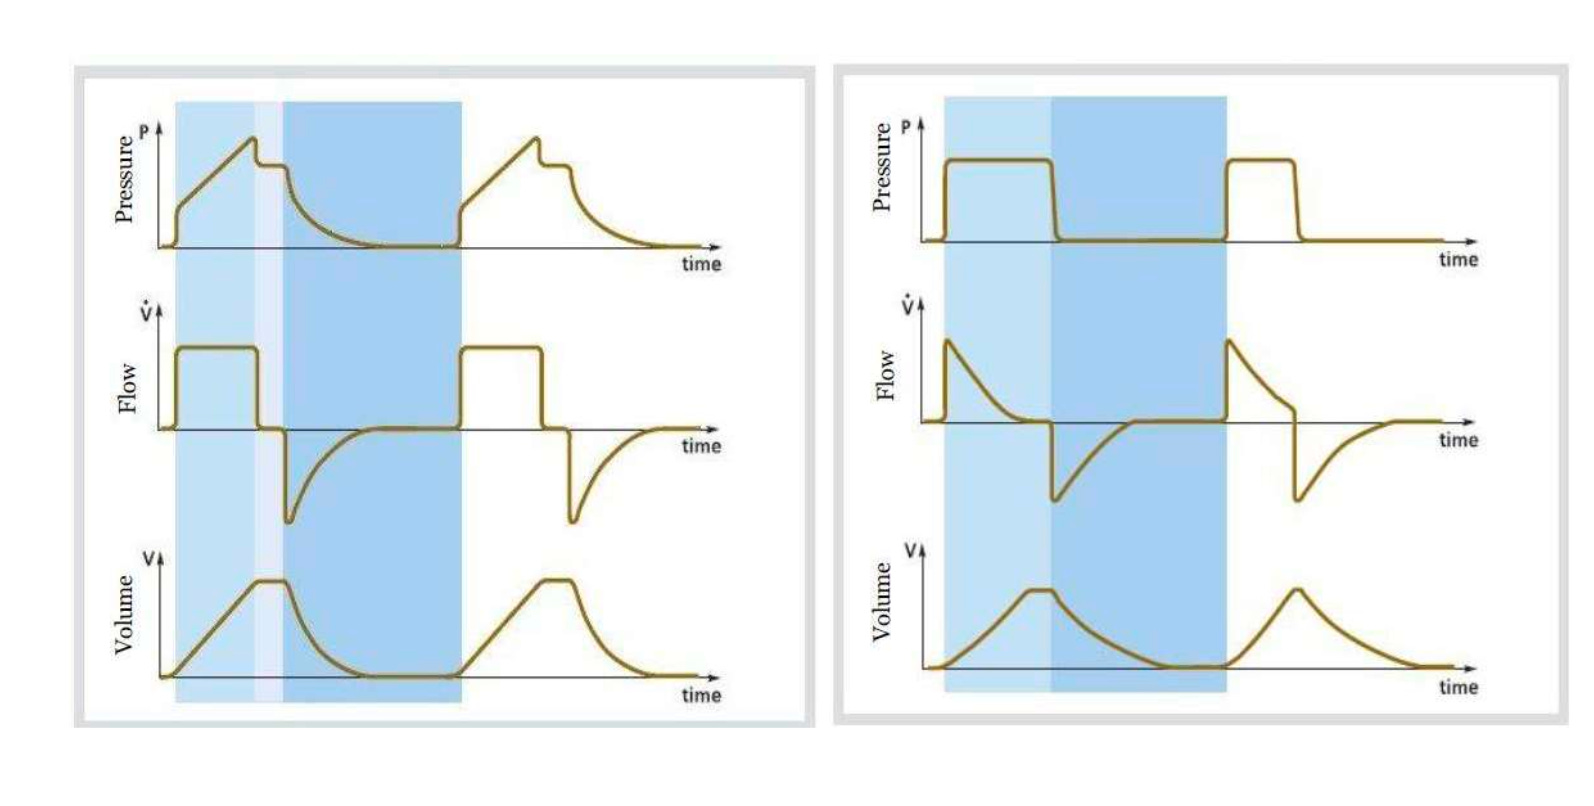
Square Flow Pattern (Volume Control)
In volume-controlled ventilation, inspiratory flow is usually constant.
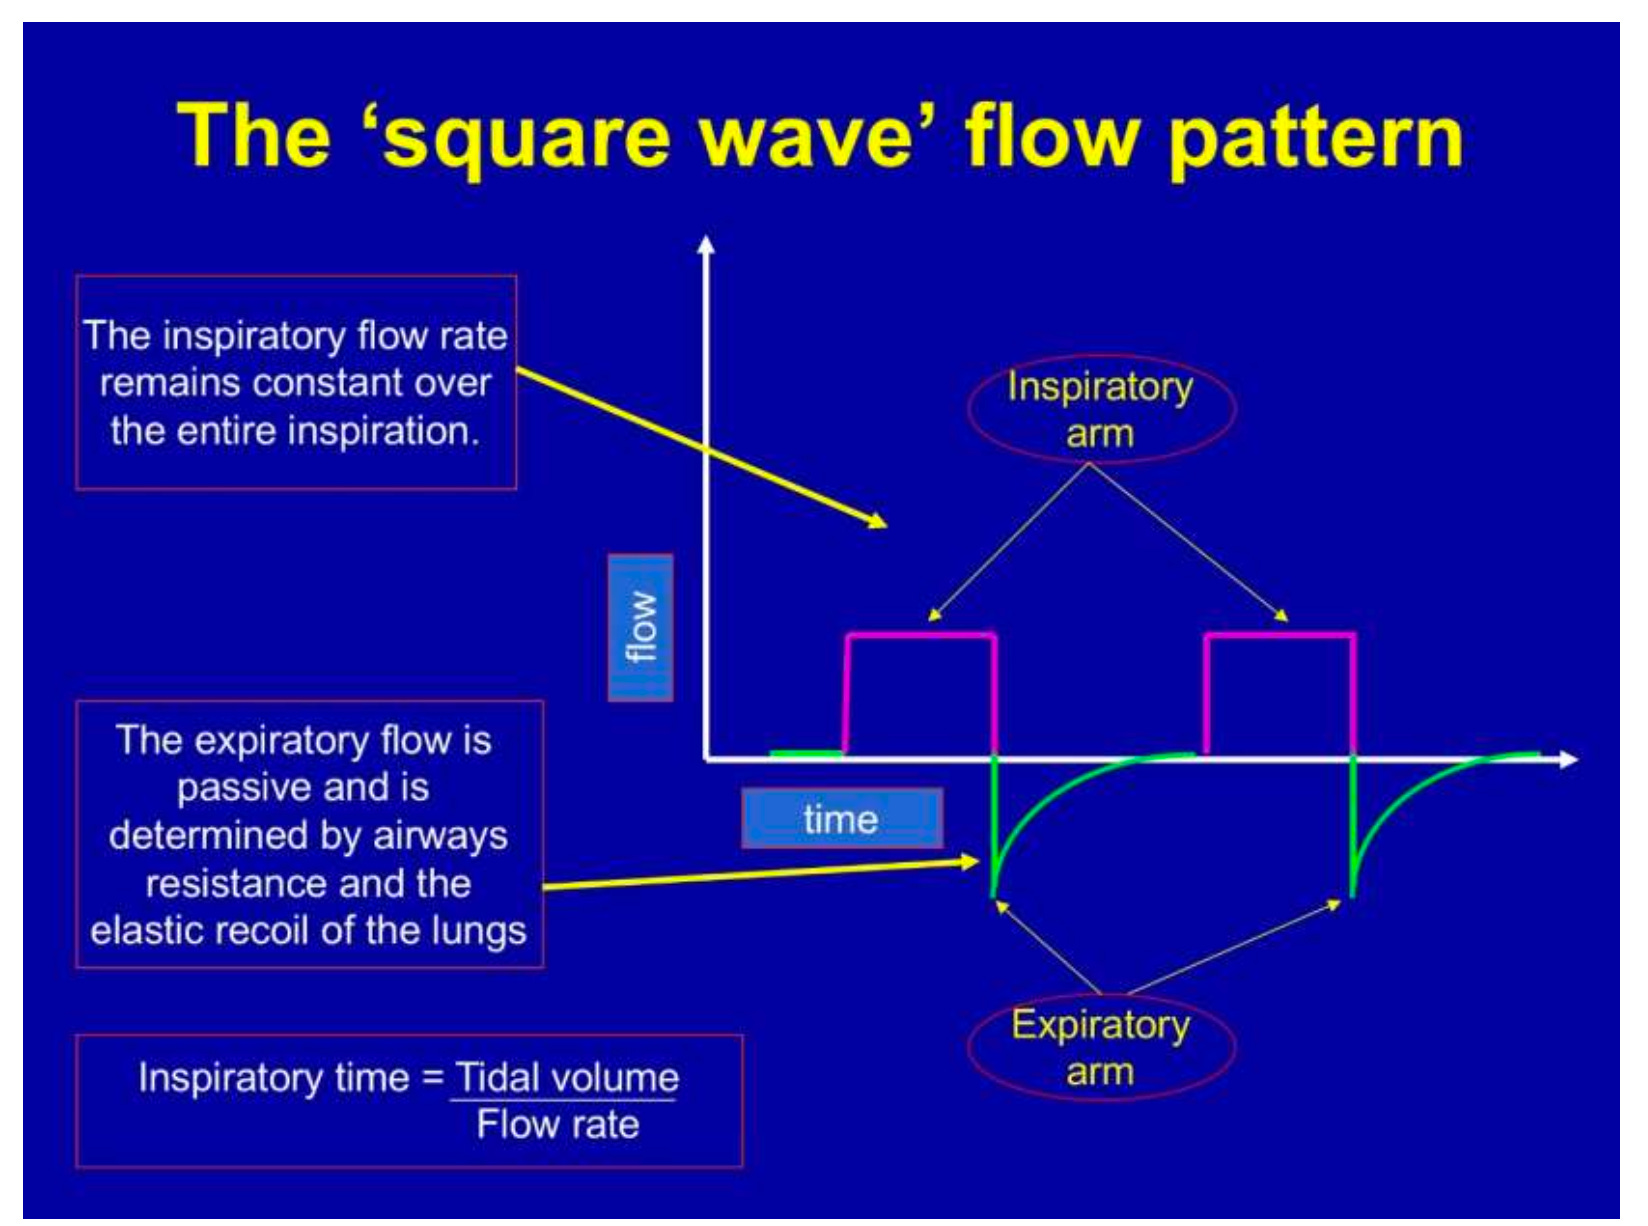
Clinical implications:
Short inspiratory time
Higher peak airway pressure
Lower mean airway pressure
This pattern is commonly used in volume assist-control ventilation.
Decelerating Flow Pattern (Pressure Control)
Pressure-controlled ventilation produces a decelerating flow pattern.
Flow starts high and gradually decreases as alveoli fill.
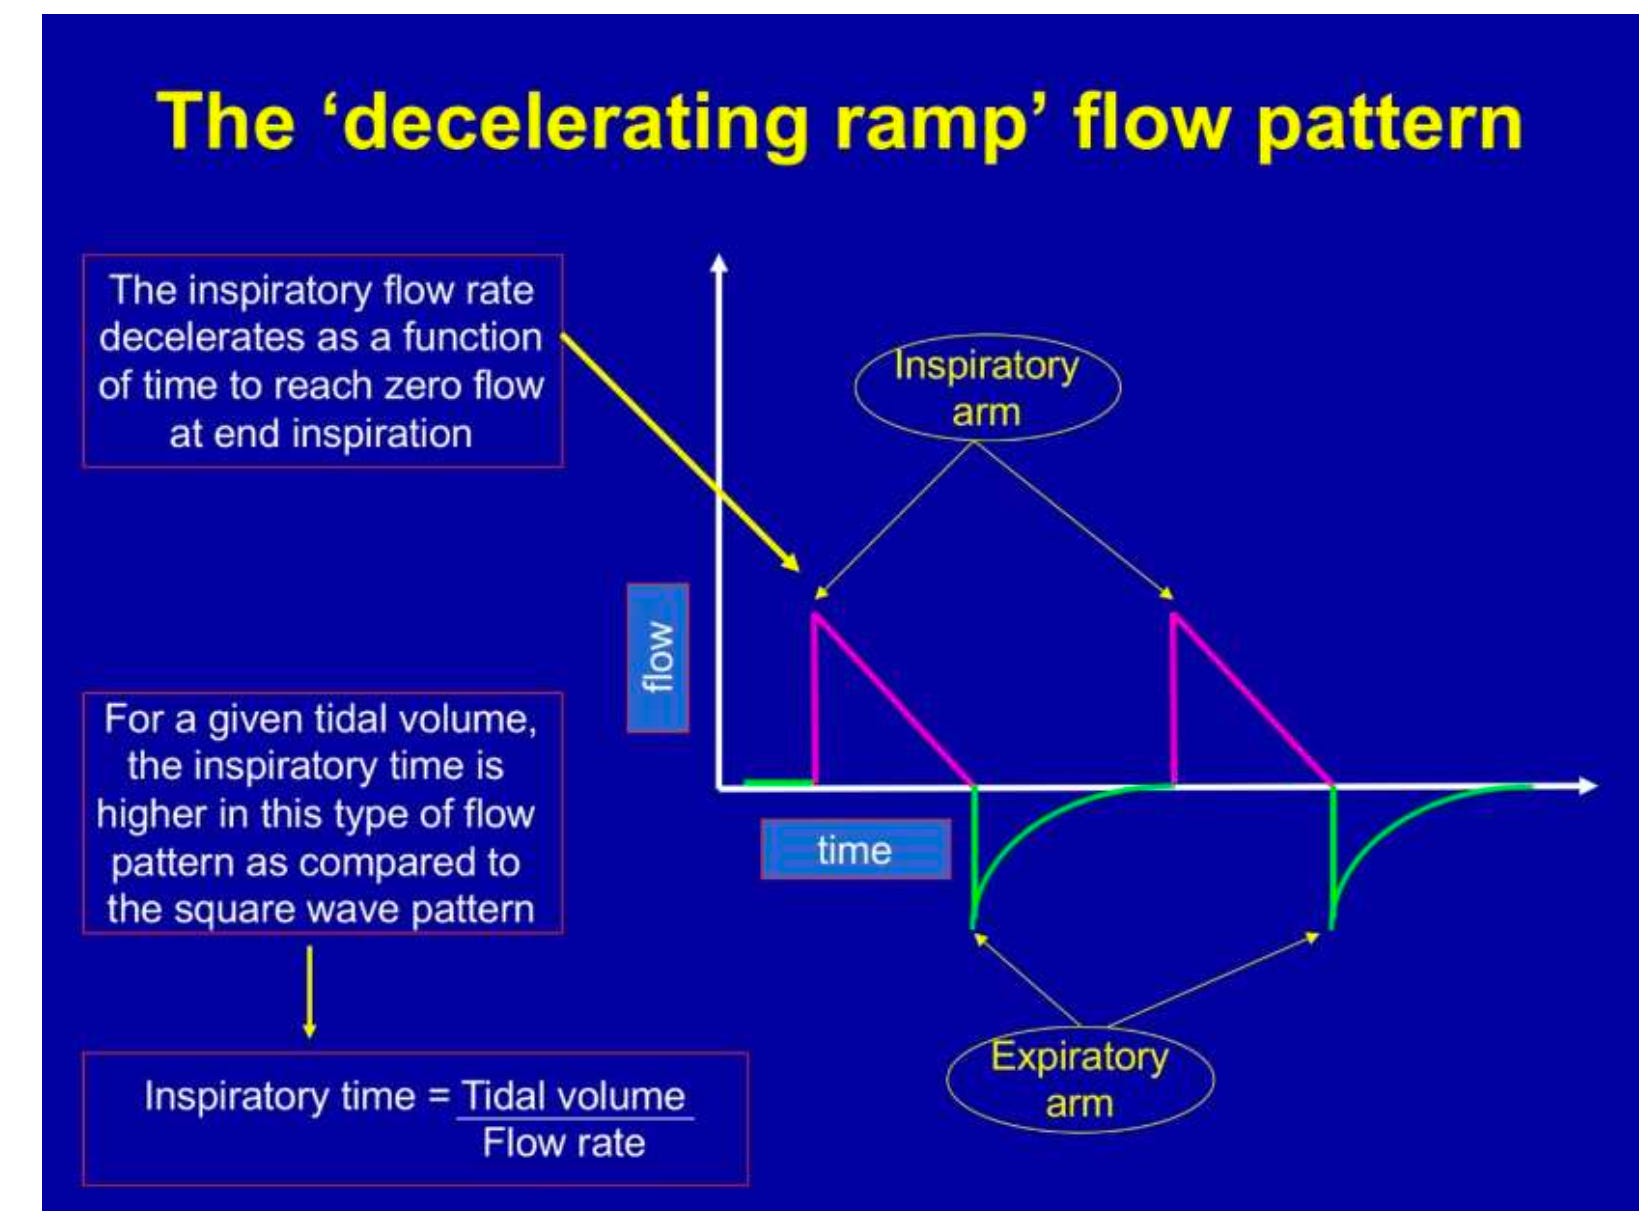
Clinical implications:
Lower peak airway pressure
Better gas distribution
Frequently used in ARDS ventilation strategies
Recognizing Air Trapping
One of the most important things to check:
Does expiratory flow return to zero?
If it does not, the lungs have not fully emptied before the next breath.
This indicates dynamic hyperinflation or auto-PEEP.
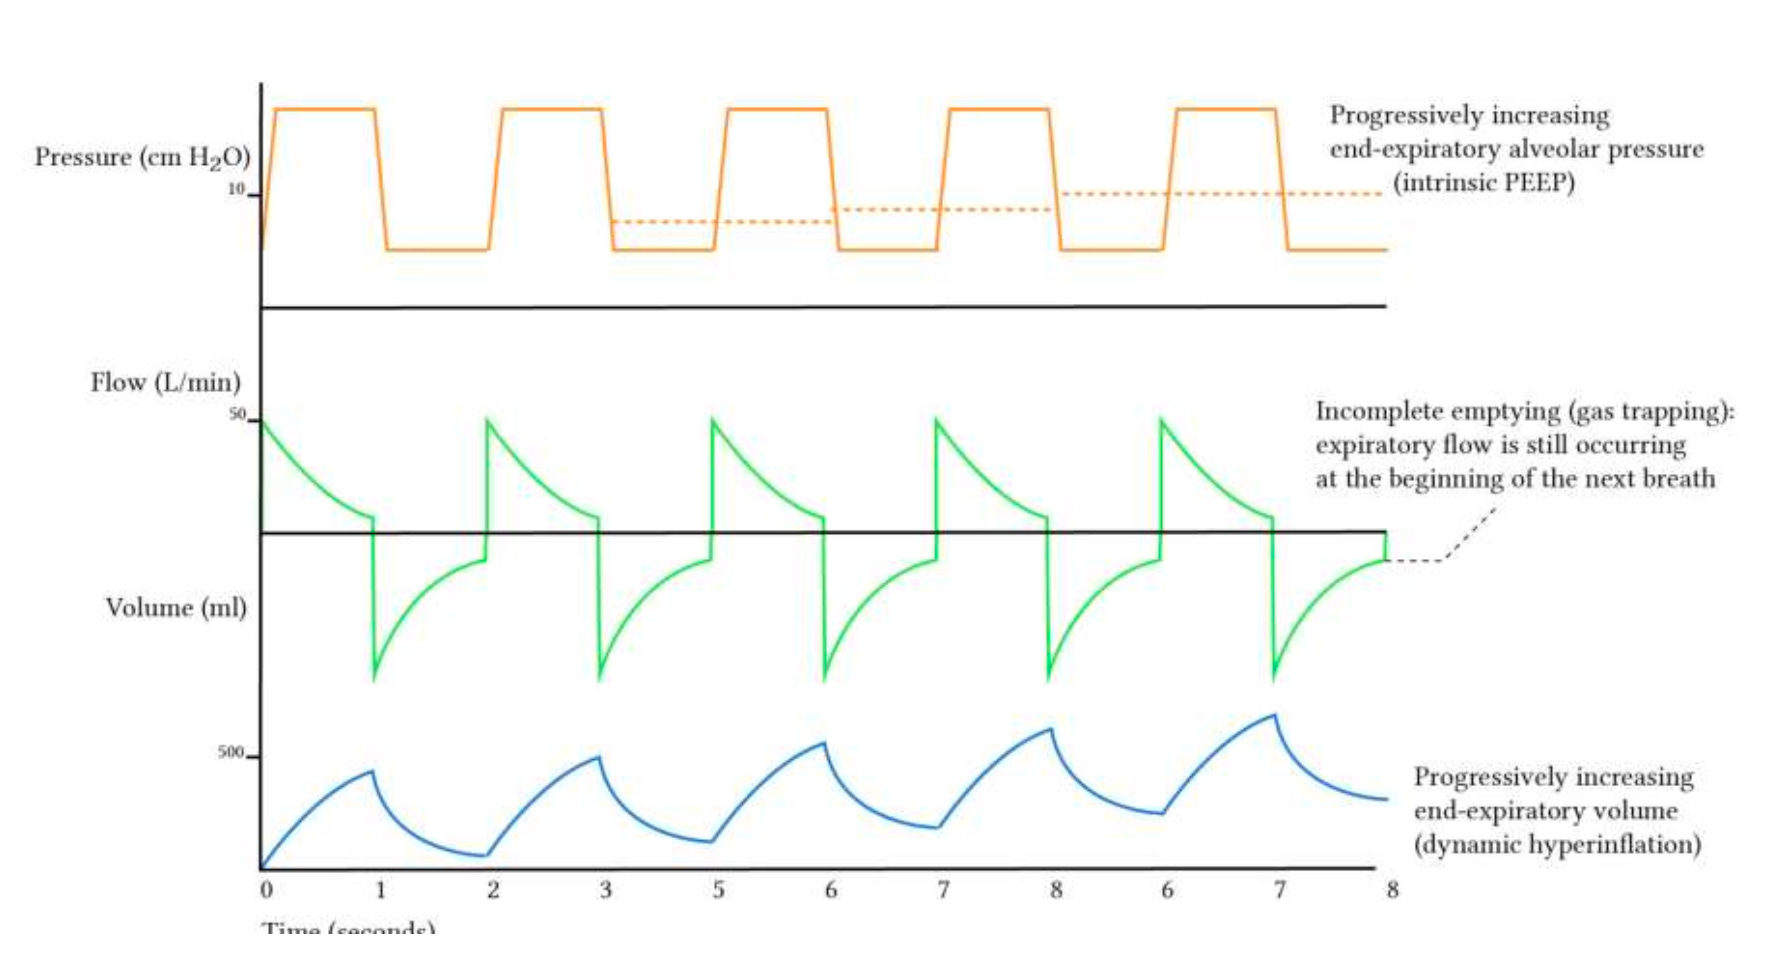
Common causes:
COPD
Asthma
High respiratory rate
Short expiratory time
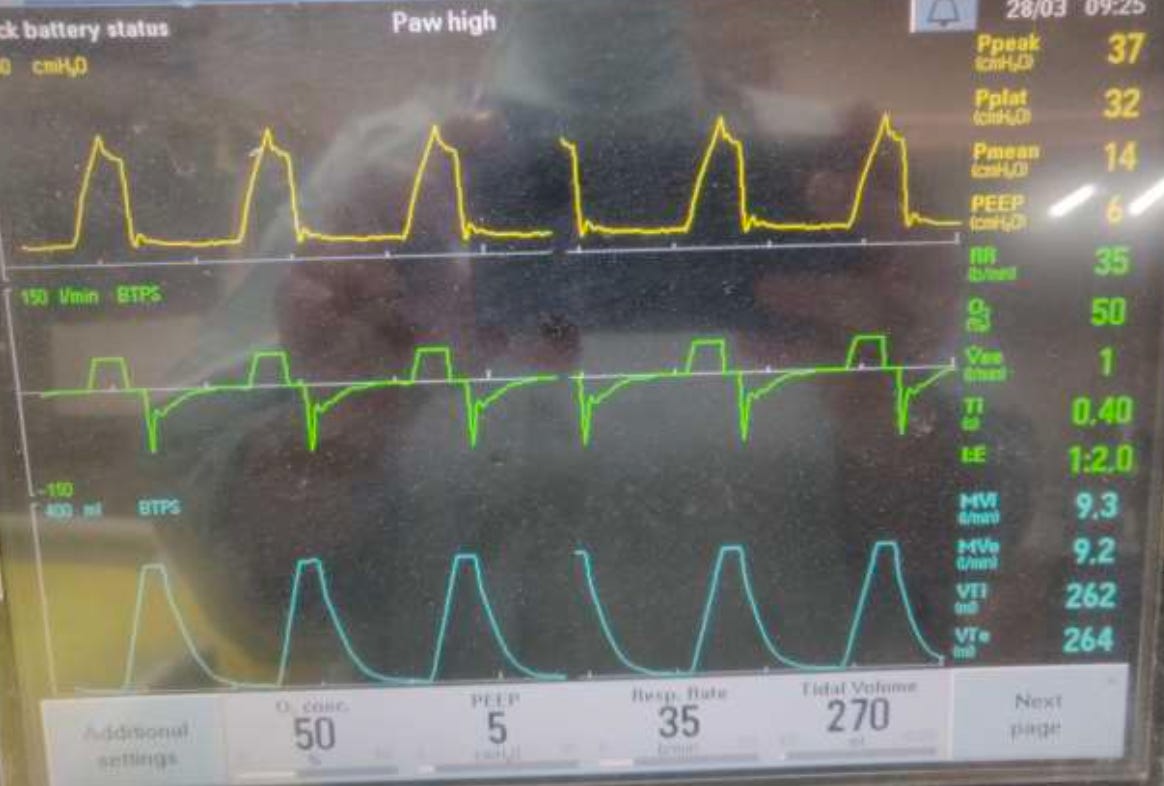
2. The Pressure–Time Waveform
The pressure waveform shows airway pressure throughout the respiratory cycle.
Baseline pressure corresponds to PEEP, while inspiratory pressure rises during tidal volume delivery.
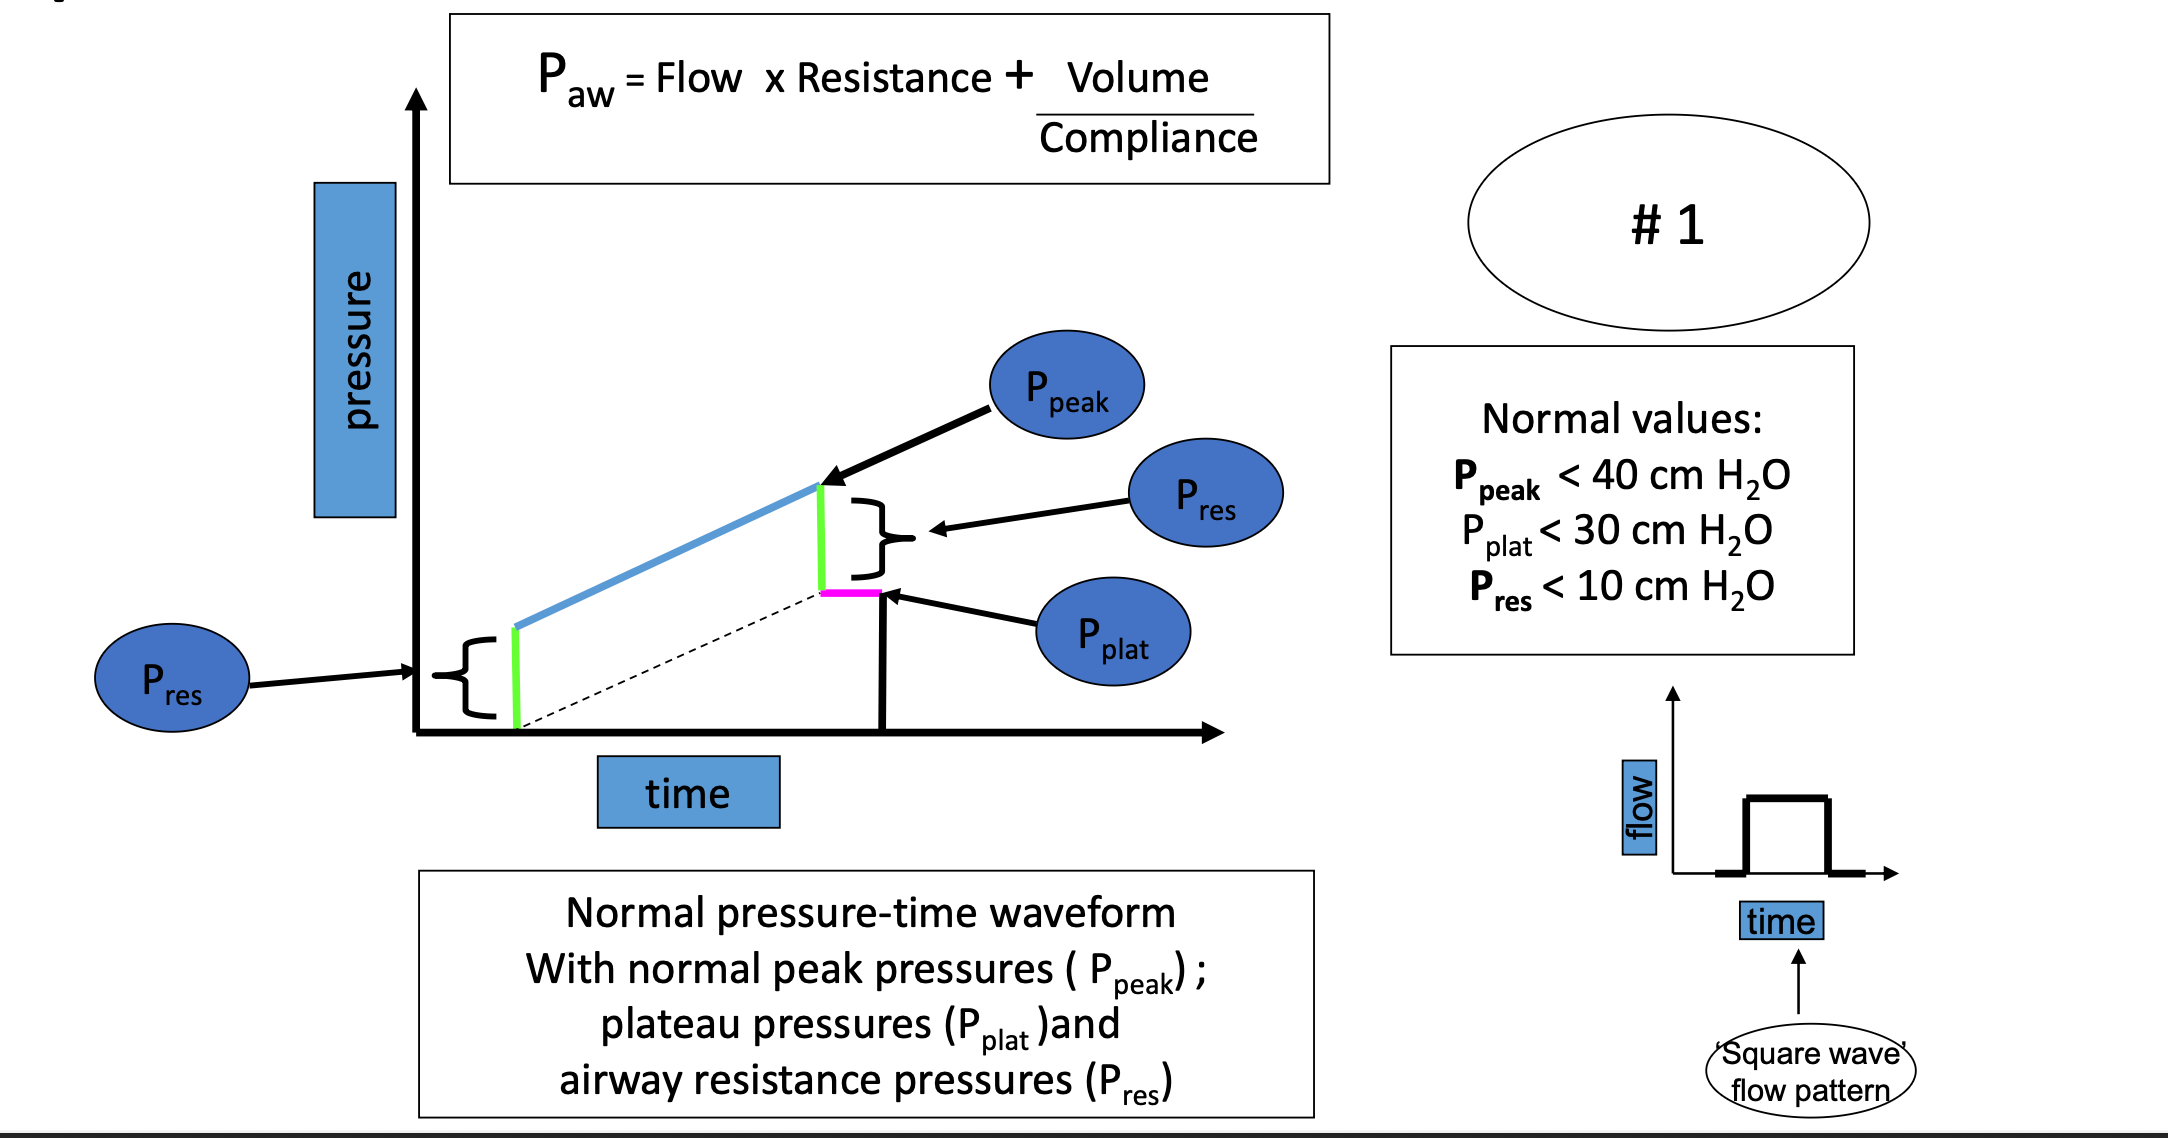
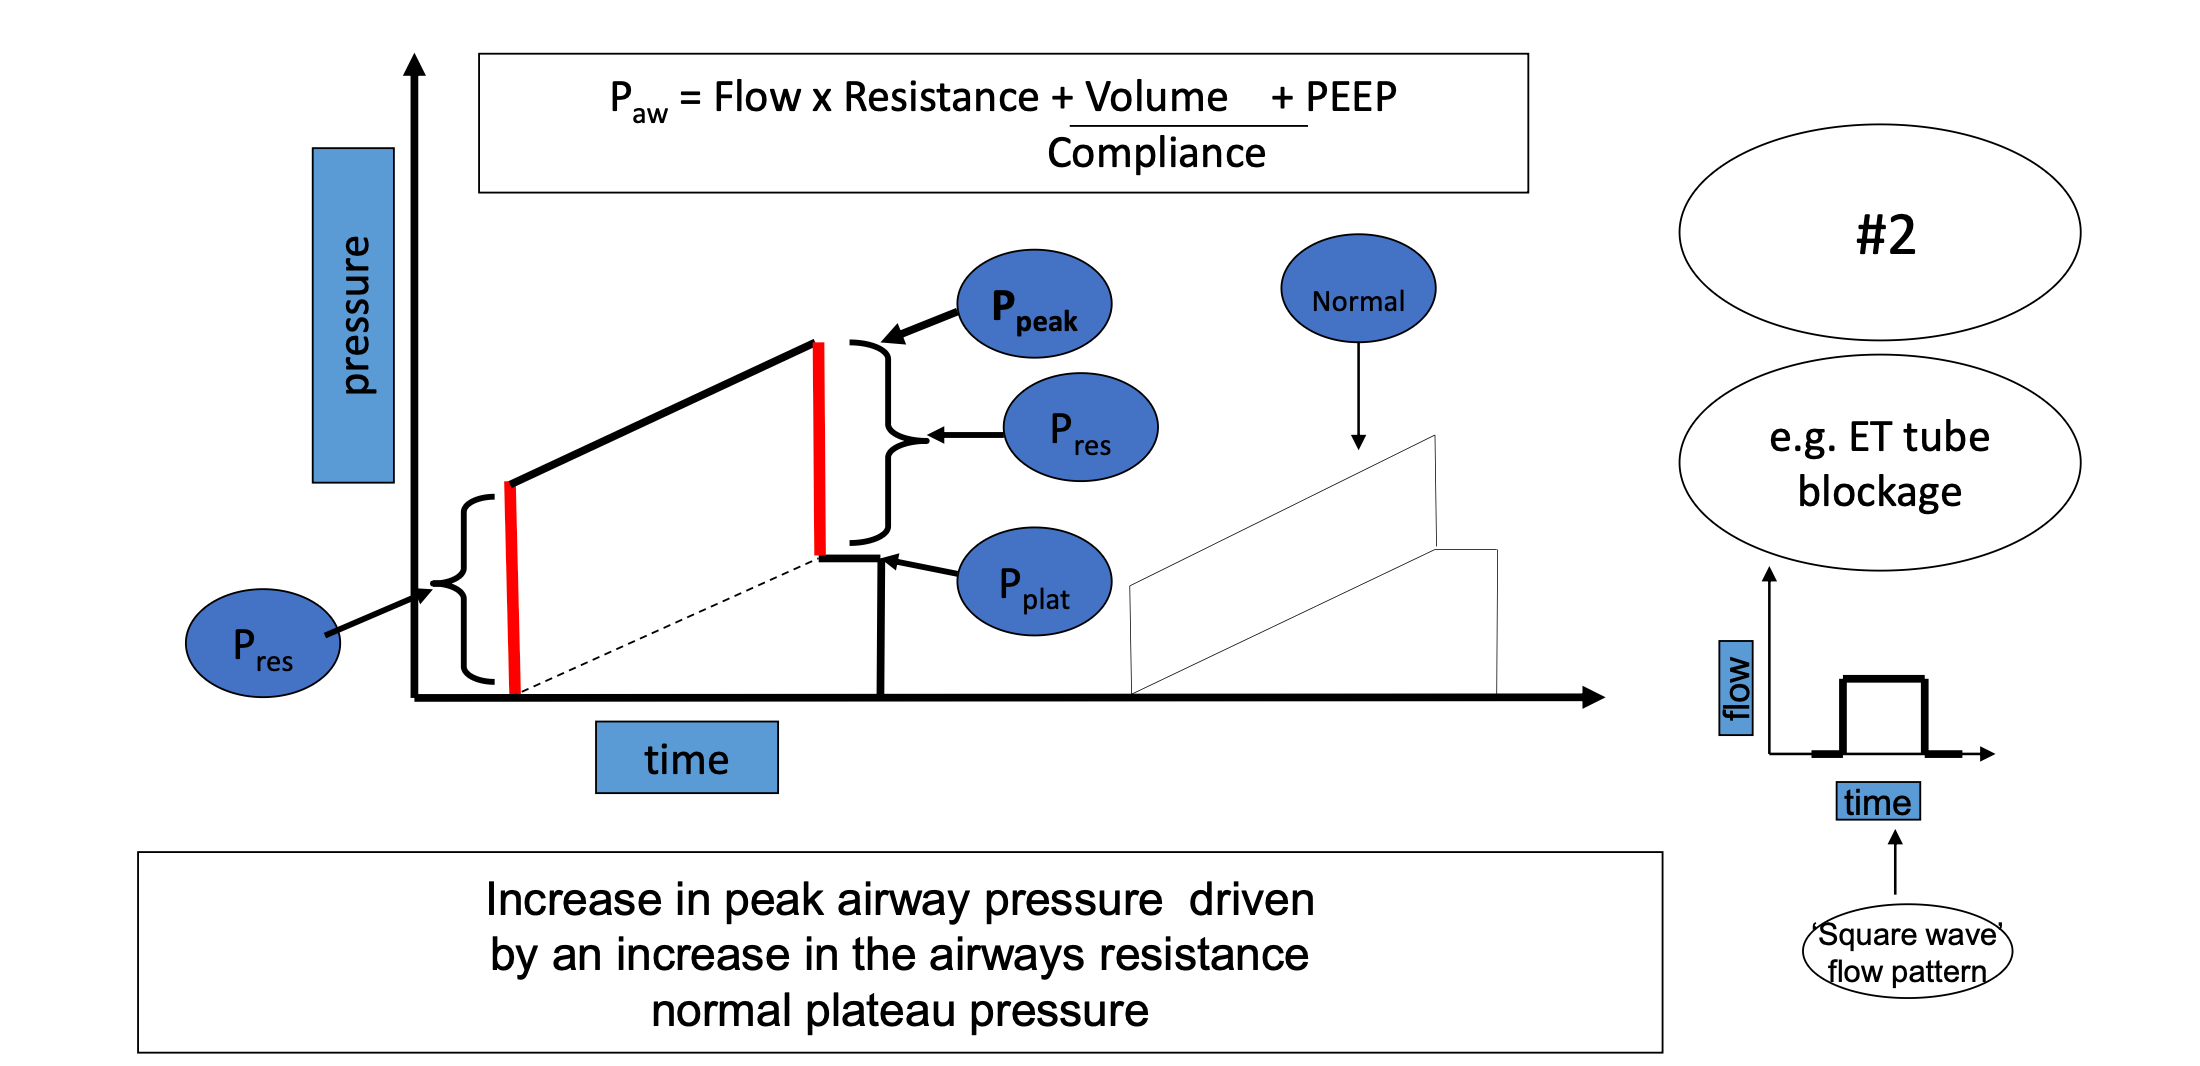
Distinguishing Resistance vs Compliance
Waveforms allow rapid bedside diagnosis.
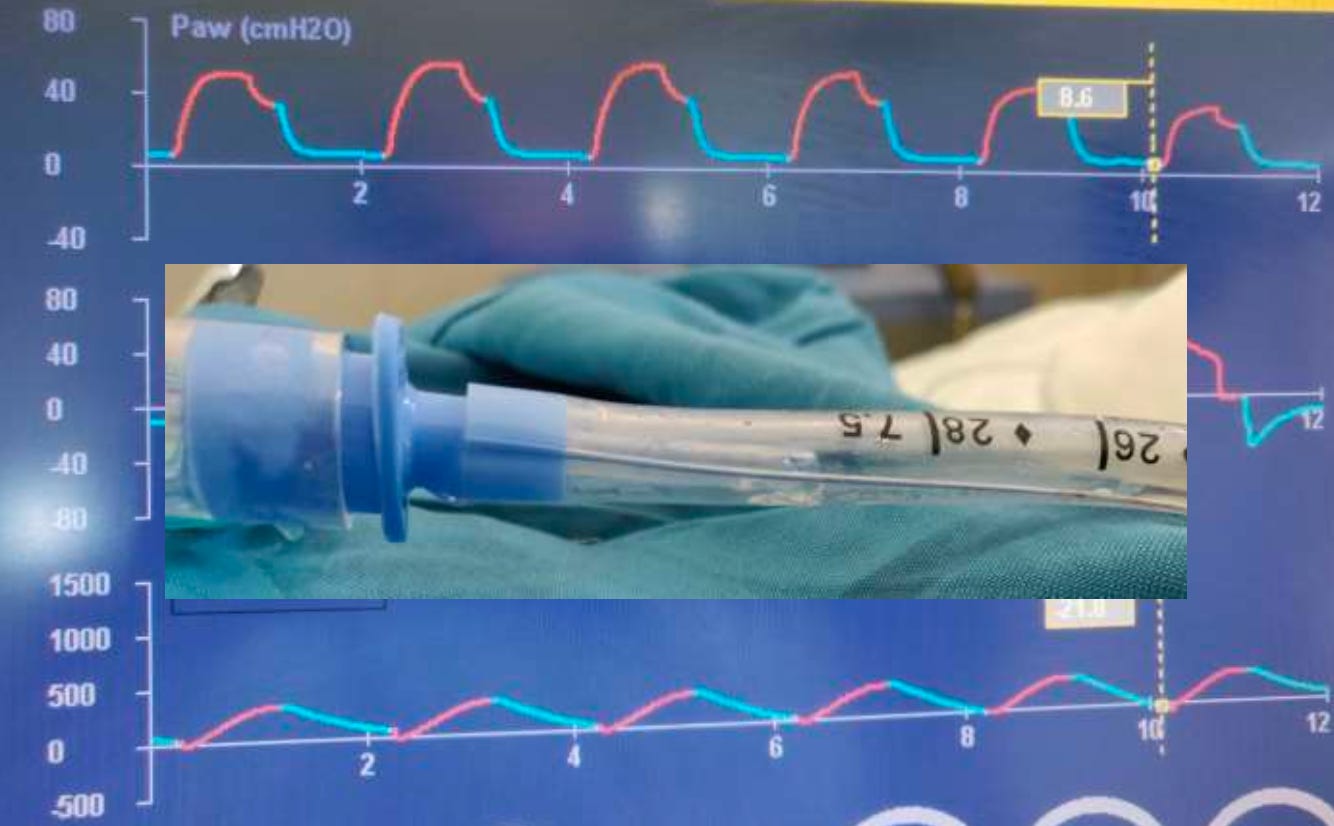
Increased Airway Resistance
Pattern:
High peak pressure
Normal plateau pressure
Causes:
Secretions
Bronchospasm
ET tube obstruction
Reduced Lung Compliance
Pattern:
High peak pressure
High plateau pressure
Causes:
ARDS
Pulmonary edema
Pneumonia
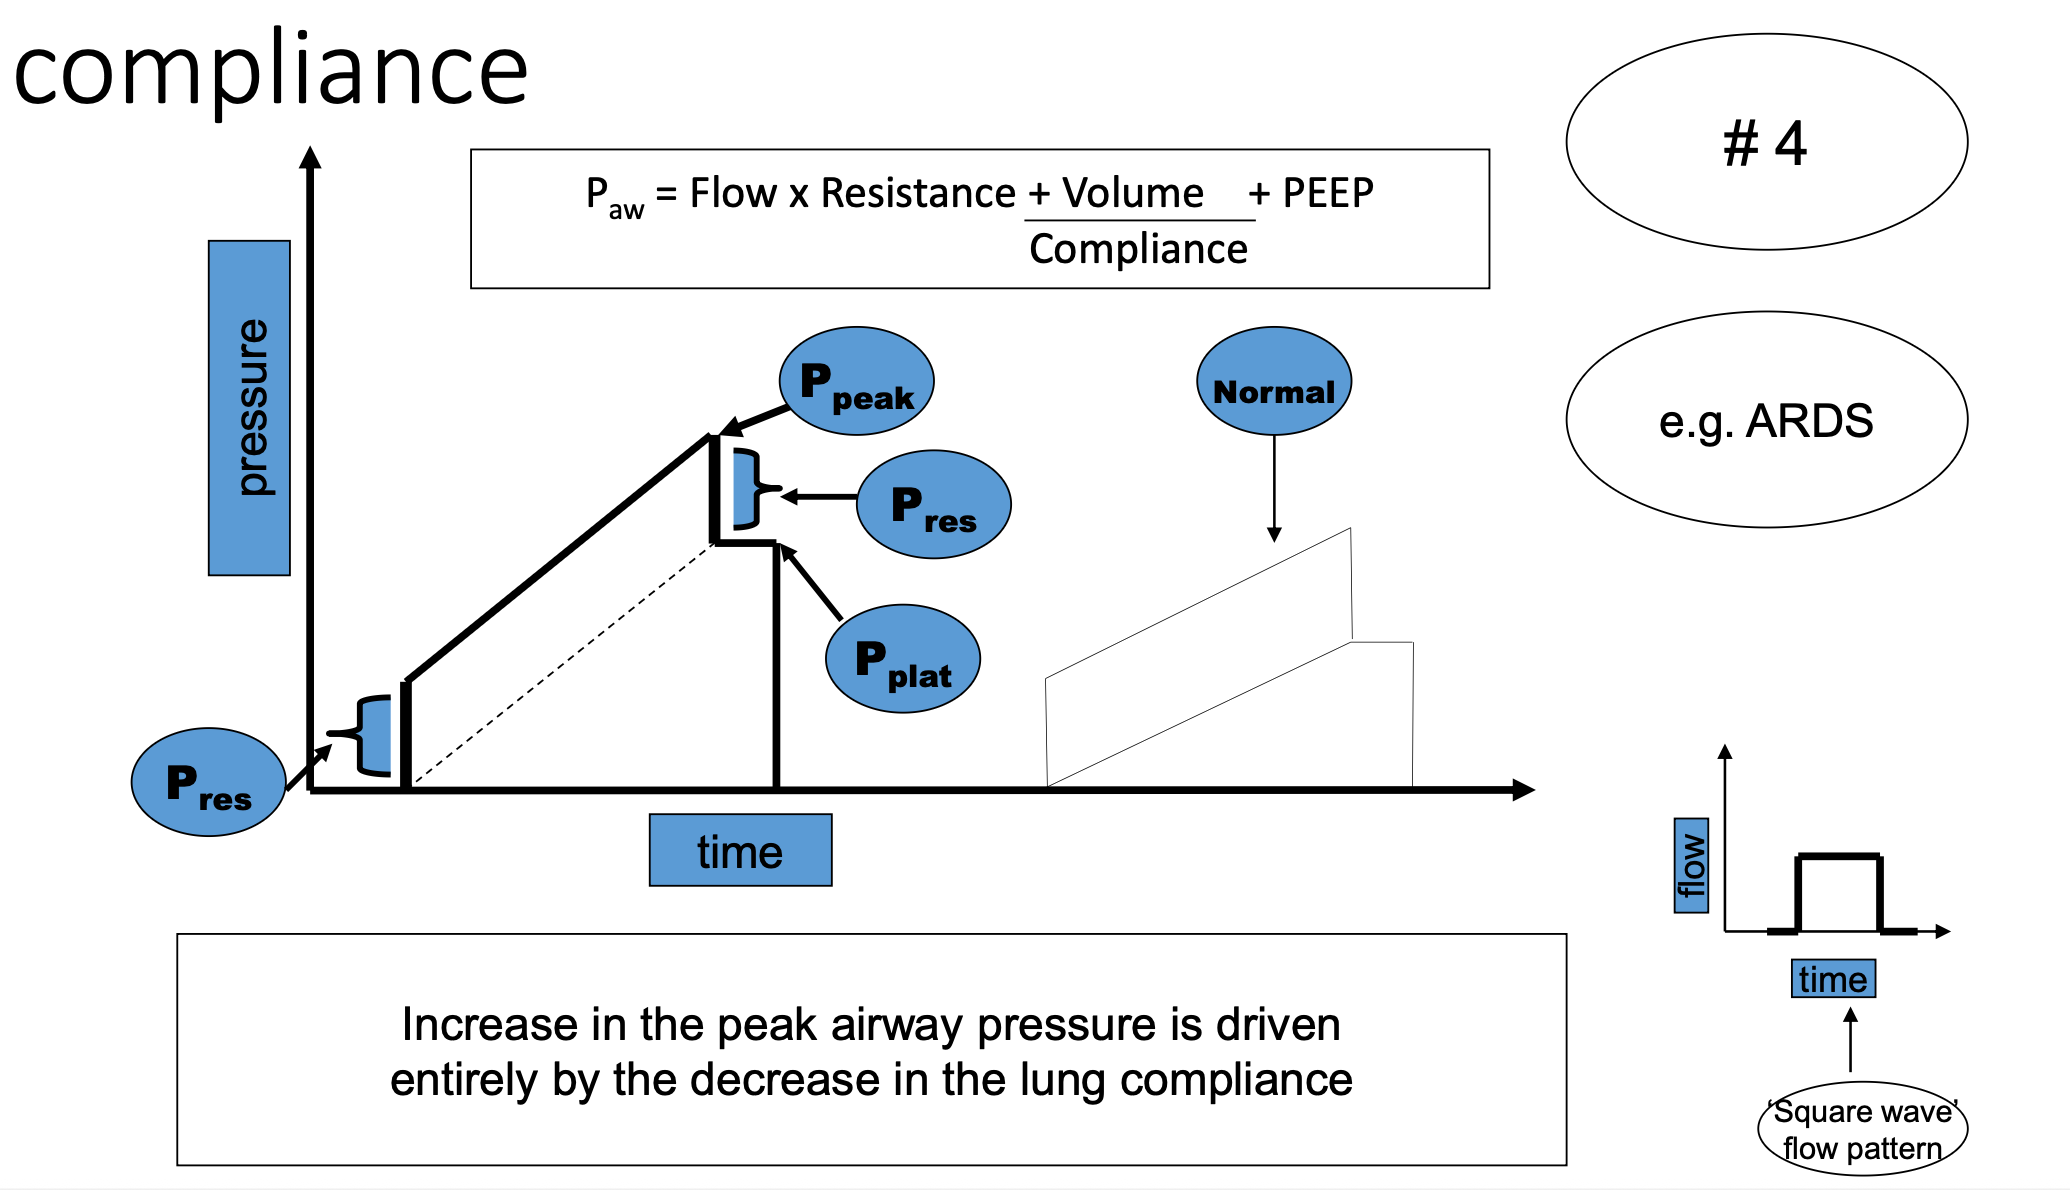
The Stress Index
Detecting Overdistension
The shape of the pressure-time curve during constant flow ventilation provides insight into lung mechanics.
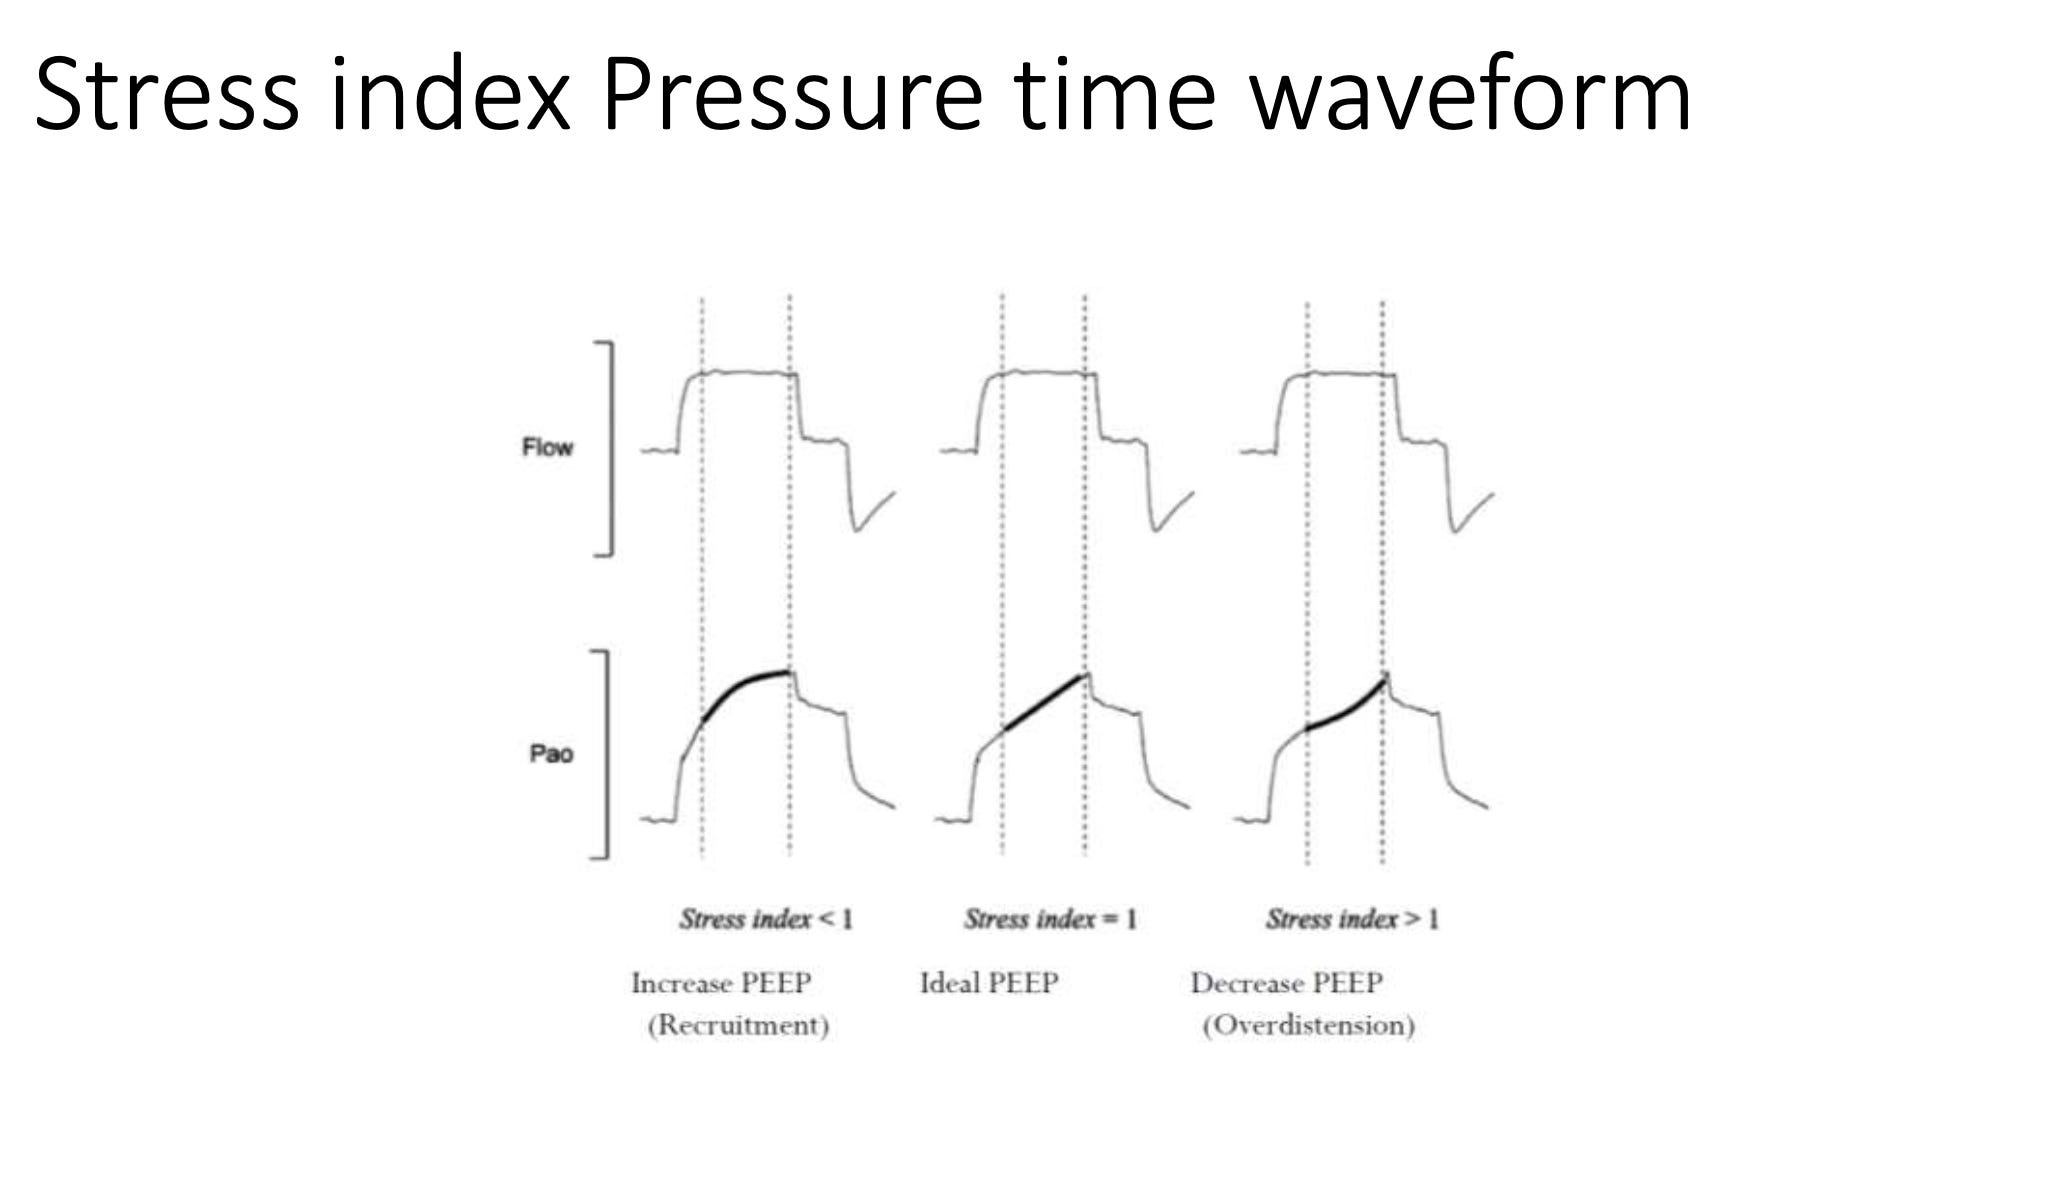
This concept is often used during lung-protective ventilation in ARDS.
3. The Volume–Time Waveform
Volume waveforms show how tidal volume changes over time.
Interestingly, ventilators do not measure volume directly. Instead, volume is calculated from the area under the flow-time curve.
This waveform helps detect:
Air leaks
Hyperinflation
Active expiration
Ventilator Waveforms Reveal Asynchrony
Waveforms also help identify patient–ventilator asynchrony.
Common patterns include:
Ineffective triggering
Patient effort fails to trigger the ventilator.
Often caused by:
Auto-PEEP
Weak respiratory muscles
Double triggering
Two breaths delivered for one patient effort.
Seen in:
ARDS
High respiratory drive
Auto-triggering
Ventilator delivers breaths without patient effort.
Possible causes:
Circuit leaks
Water in tubing
Cardiac oscillations
What Comes Next
In this article, we focused on the three ventilator scalars:
Pressure–time
Flow–time
Volume–time
These waveforms allow clinicians to quickly recognize changes in airway resistance, lung compliance, air trapping, and patient–ventilator interaction.
But the ventilator screen offers even deeper physiological insight.
In Part 2, we will decode the ventilator loops — including:
Pressure–Volume loops
Flow–Volume loops
These loops help identify:
Overdistension
Recruitment
Optimal PEEP
Airway obstruction
Understanding loops transforms ventilator interpretation from pattern recognition into true respiratory physiology.
Creator
Dr Arihant Jain, MD
lifeonthefrontline.com
Follow on Instagram: @humans.of.em
👍
Thank you sir