
The Ventilator Screen Decoded — Part 2
Ventilator Circuits, the Equation of Motion, and How to Interpret Ventilator Loops

In Part 1, we learned how to read the three ventilator scalars:
Pressure–time
Flow–time
Volume–time
These waveforms help identify problems such as airway obstruction, compliance changes, and ventilator asynchrony.
But the ventilator screen offers another powerful tool.
Loops.
Ventilator loops allow clinicians to visualize the relationship between pressure, flow, and volume during a single breath — providing deeper insight into lung mechanics.
Before interpreting loops, however, we must understand the mechanics of the ventilator circuit and the equation that governs ventilation.
The Ventilator Circuit
At its core, the mechanical ventilation system consists of two interacting pumps:
The ventilator
The patient’s respiratory system
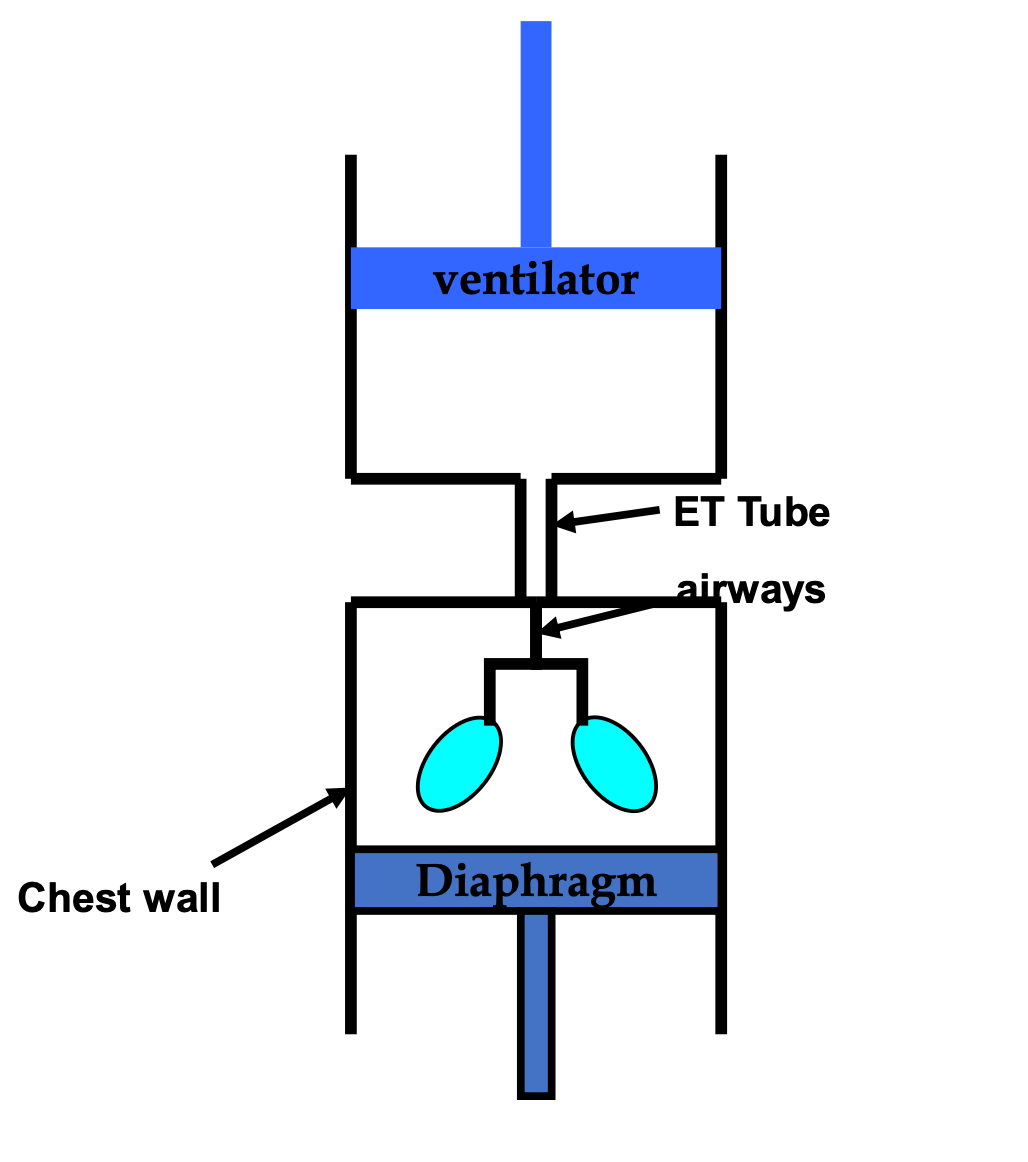
These are connected by the endotracheal tube and ventilator circuit.
The ventilator generates positive pressure that pushes gas into the lungs, while the respiratory system offers resistance and elastic recoil.
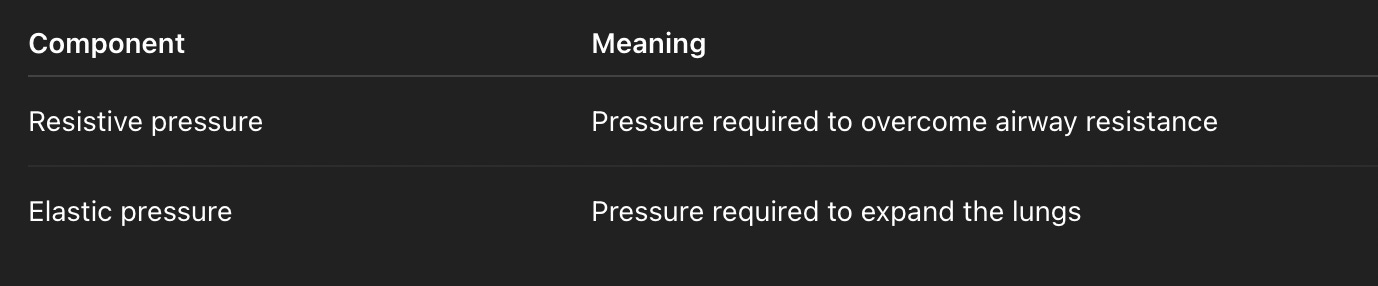
The respiratory system can be simplified into two components:
1. Resistive Component
This includes:
Endotracheal tube
Airways
Bronchi
Resistance determines how difficult it is for air to move through the airway.
Examples of increased resistance:
Bronchospasm
Secretions
ET tube obstruction
2. Elastic Component
This includes:
Lung tissue
Chest wall
Elastic recoil determines how much pressure is required to expand the lungs.
Examples of reduced compliance:
ARDS
Pulmonary edema
Pneumonia
The Equation of Motion for the Respiratory System
Mechanical ventilation follows a fundamental equation known as the equation of motion.
It describes the pressure required to inflate the lungs.
The equation is:
Airway Pressure = (Flow × Resistance) + (Volume ÷ Compliance)
This equation explains why airway pressure increases during ventilation.
Pressure generated by the ventilator must overcome:
1️⃣ Airway resistance
2️⃣ Elastic recoil of the lungs and chest wall
This explains a key ventilator concept:
Peak pressure reflects both resistance and compliance, while plateau pressure reflects compliance alone.
Understanding this equation is essential before interpreting ventilator loops.
What Are Ventilator Loops?
Unlike scalars, which plot variables against time, loops plot variables against each other.
This allows clinicians to visualize the relationship between pressure, flow, and volume during a breath.
The two most important loops are:
1️⃣ Pressure–Volume (PV) loop
2️⃣ Flow–Volume loop
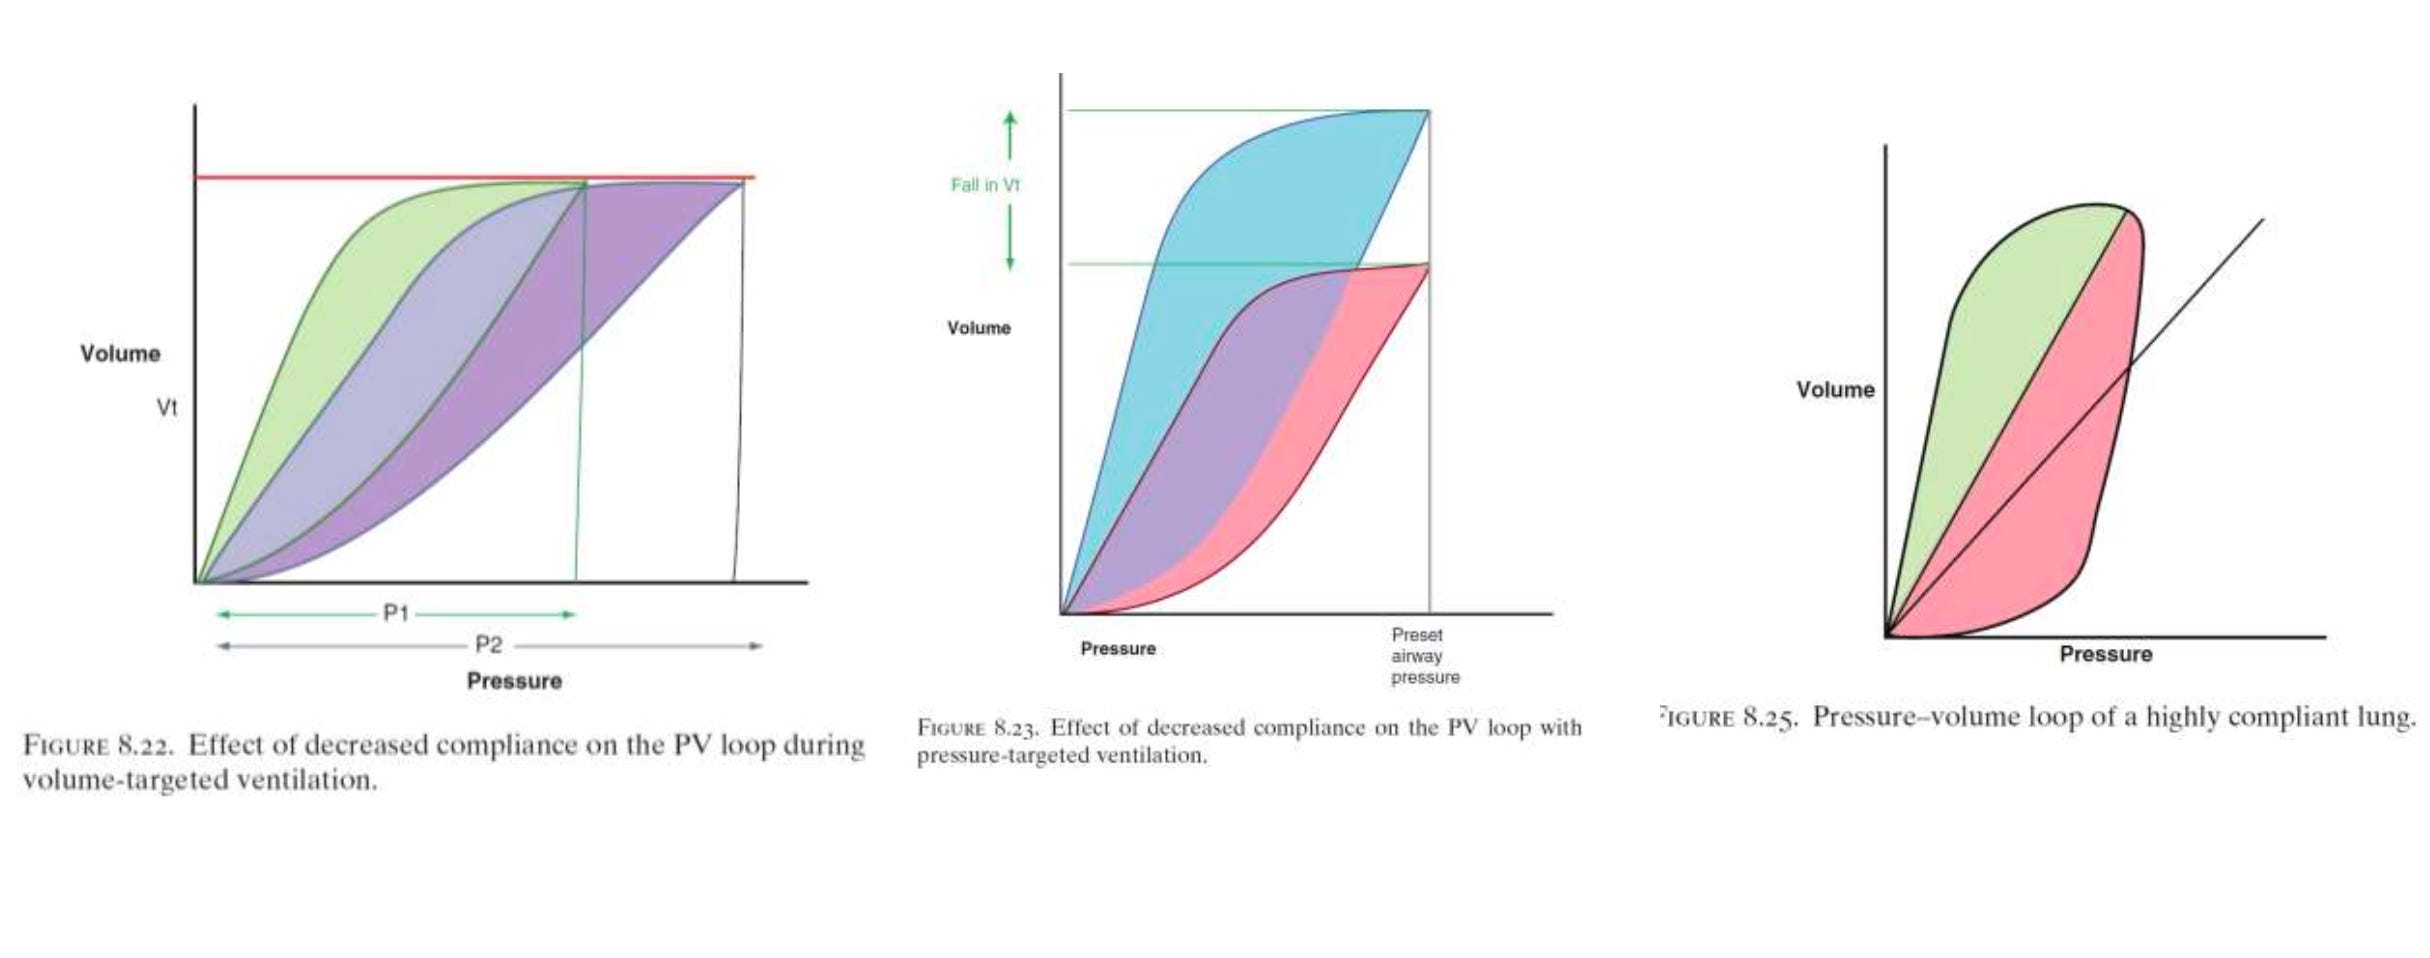
These loops reveal information about:
Lung compliance
Airway obstruction
Air trapping
Overdistension
Optimal PEEP
The Pressure–Volume Loop
The pressure–volume loop plots airway pressure on the X-axis and volume on the Y-axis.
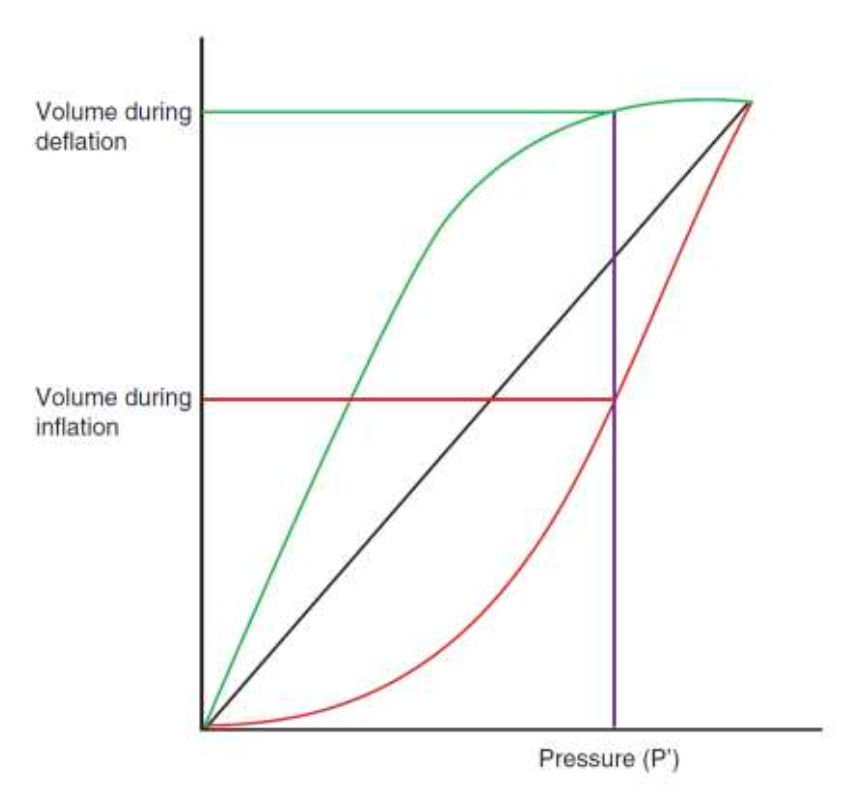
During mechanical ventilation, the loop moves counterclockwise.
The loop begins at the end of expiration and moves upward as the lungs fill with air.
As pressure increases, volume increases.
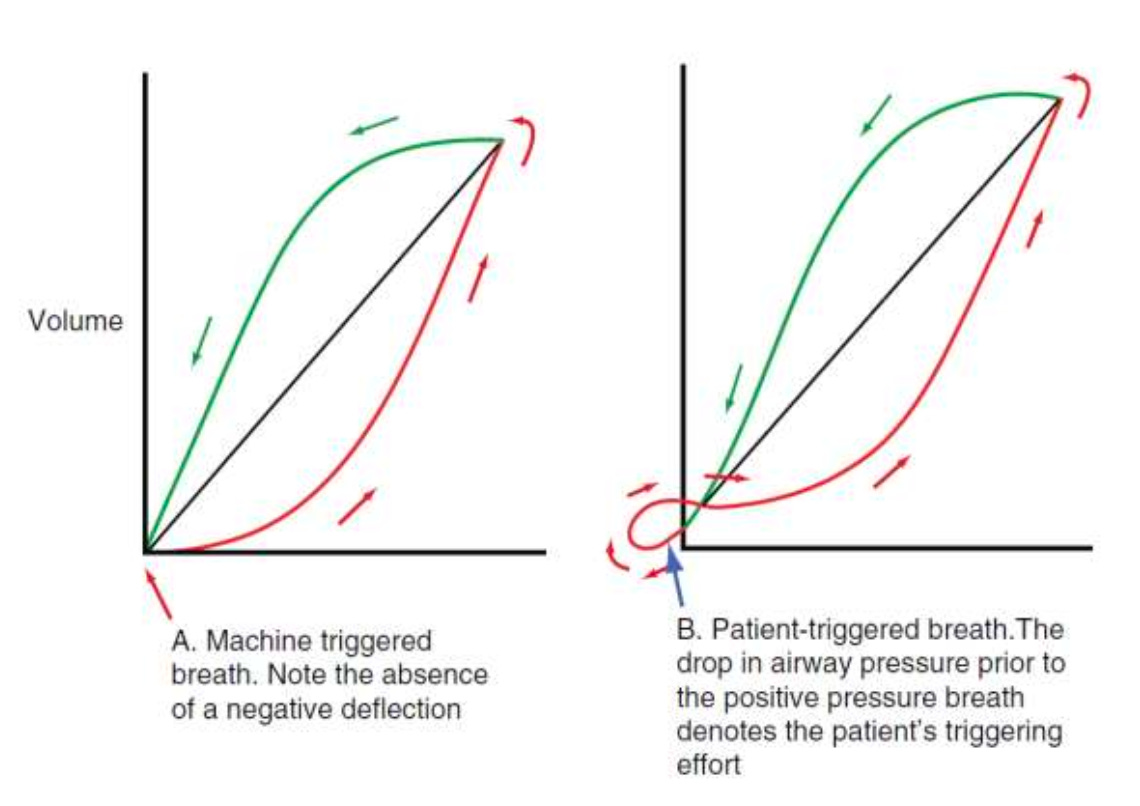
During expiration, the curve follows a different path back to the starting point.
This difference between inspiratory and expiratory curves is called hysteresis.
It reflects the surface tension and recruitment dynamics of the lung.
Key Points on the Pressure–Volume Loop
Several important landmarks can be identified on the PV loop.
Lower Inflection Point
This point represents the pressure at which alveoli begin to open.
Below this pressure, many alveoli remain collapsed.
Clinically, this helps guide PEEP selection.
Upper Inflection Point
This represents the point where alveoli begin to overdistend.
Beyond this point, additional pressure produces little increase in volume.
This region increases the risk of ventilator-induced lung injury.
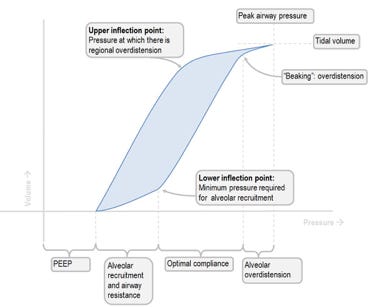
Detecting Over-distension
When the upper part of the PV loop flattens or bends outward, it suggests that the lungs are being overinflated.
")
Common causes include:
Excessive tidal volume
High inspiratory pressures
Inadequate lung protective ventilation
Management:
Reduce tidal volume
Reduce driving pressure
Optimize PEEP
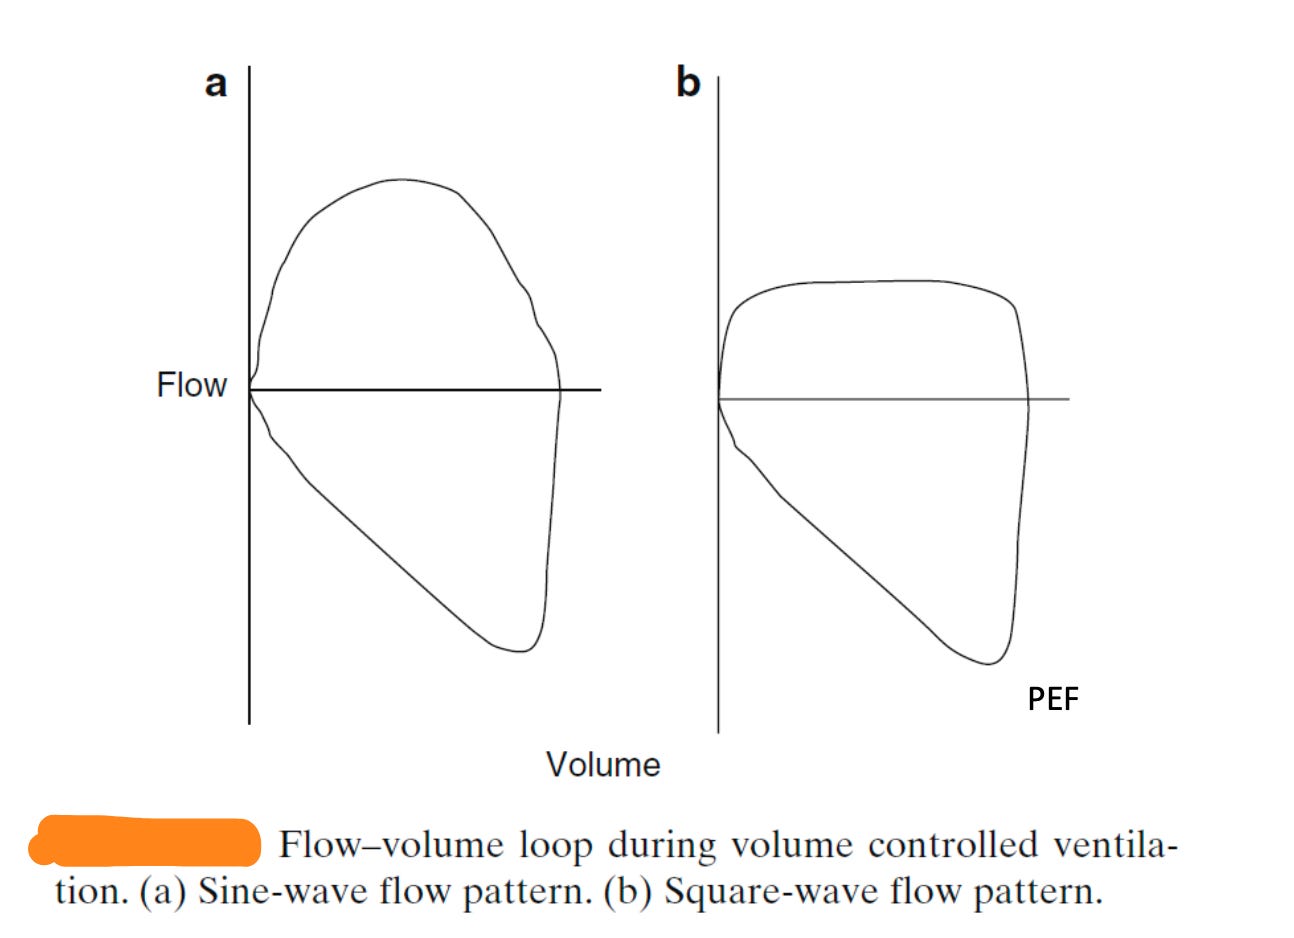
The Flow–Volume Loop
The flow–volume loop plots:
Flow (Y-axis)
Volume (X-axis)
The loop consists of:
Inspiratory limb (above baseline)
Expiratory limb (below baseline)
Changes in the loop shape provide clues about airway resistance, obstruction, and air trapping.
1. Normal Flow–Volume Loop
Characteristics:
Smooth inspiratory limb
Rapid peak expiratory flow
Gradual return to baseline
Loop closes completely
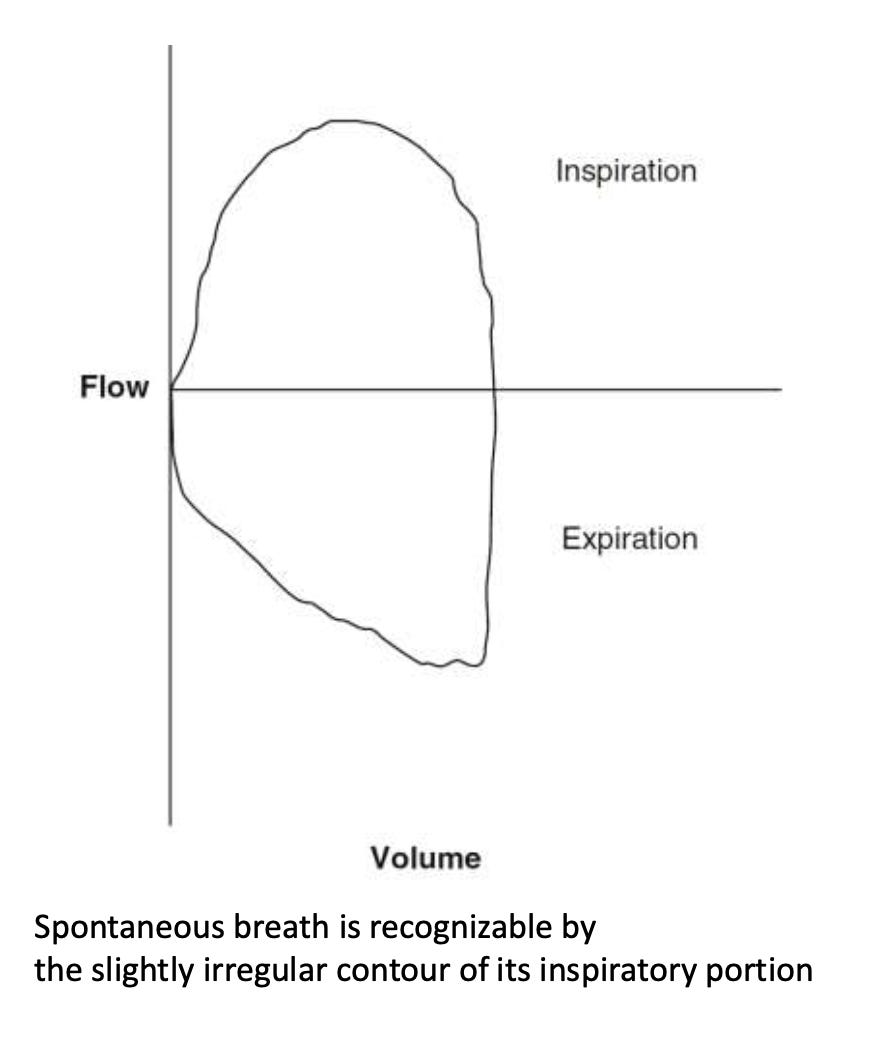
Clinical meaning:
Normal airway resistance and lung compliance.
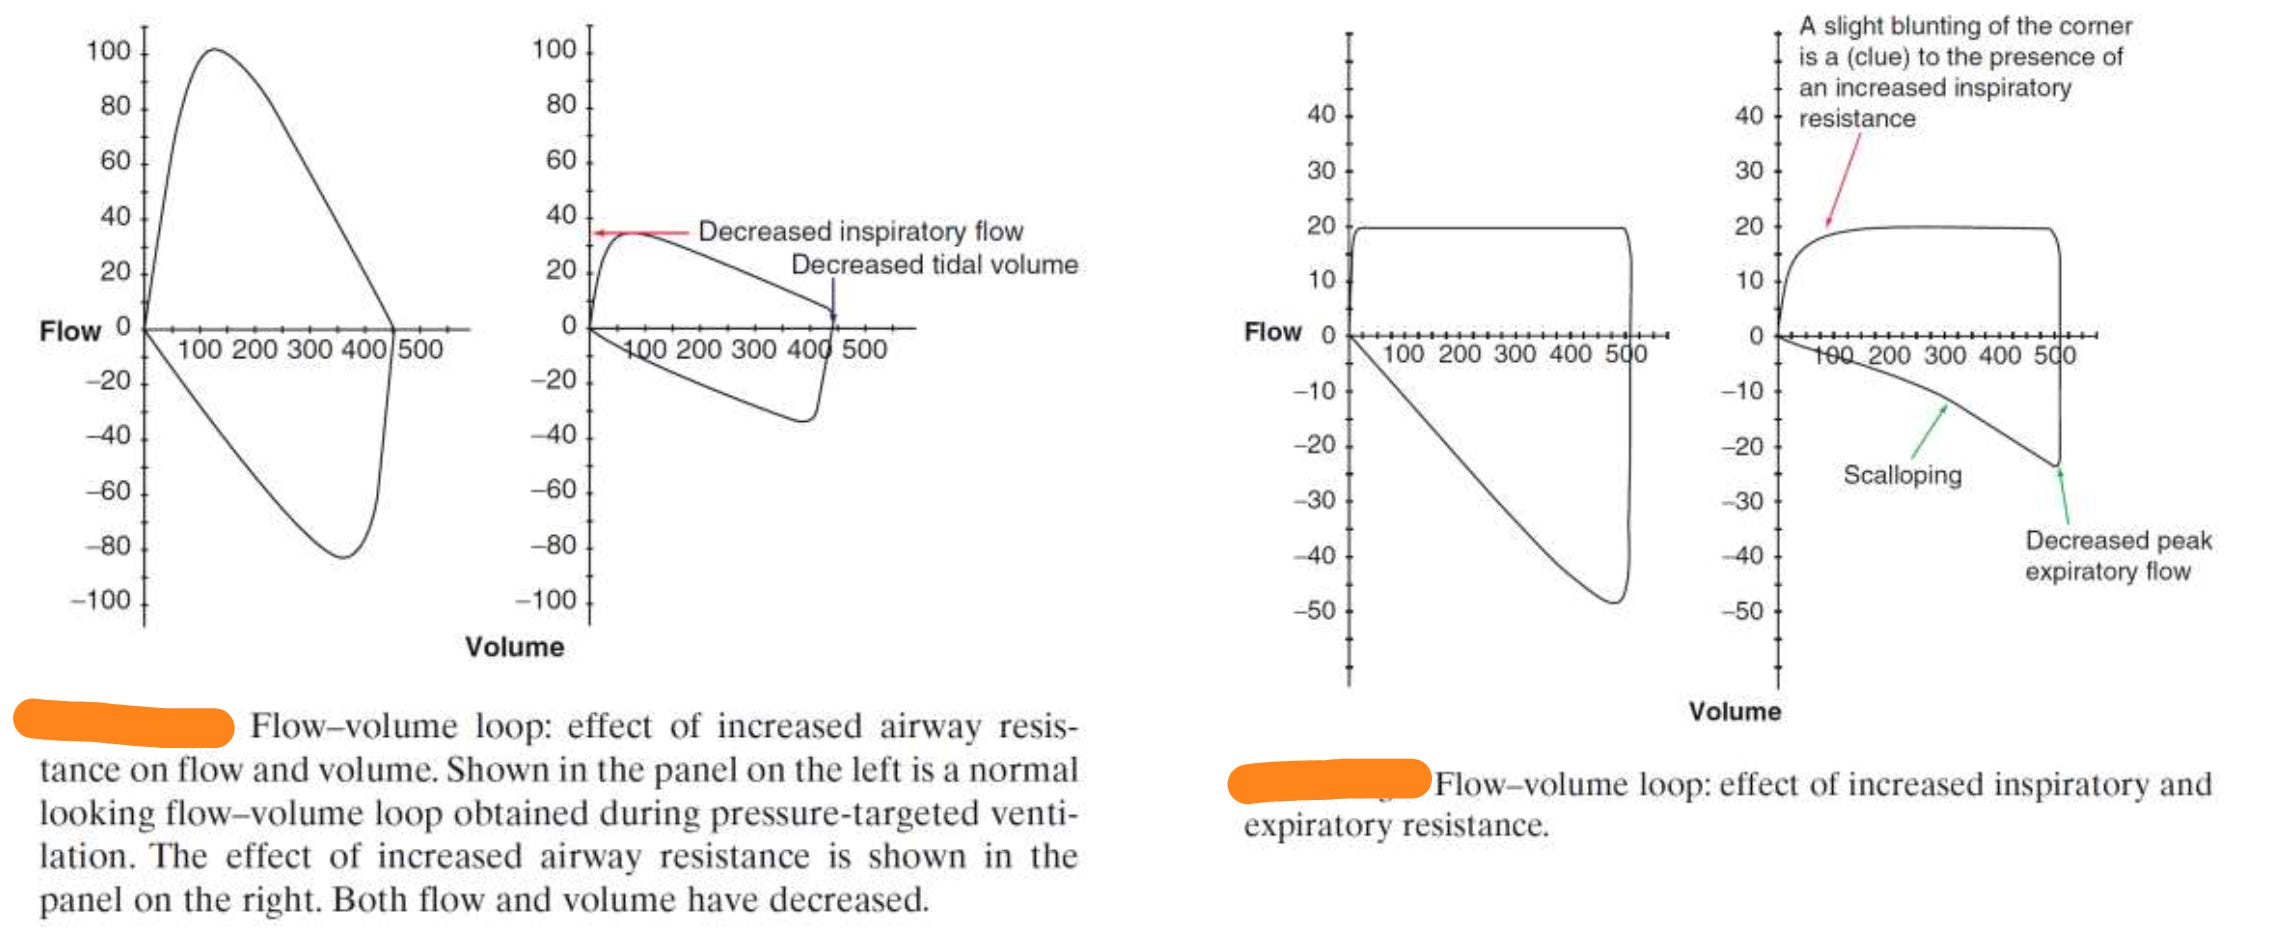
2. Obstructive Lung Disease (COPD / Asthma)
Classic pattern:
Scooped-out expiratory limb
Features:
Reduced peak expiratory flow
Concave expiratory curve
Prolonged expiration
Seen in:
COPD
Asthma
Bronchospasm
Airway obstruction
Clinical interpretation:
Airflow limitation prevents rapid emptying of the lungs.
3. Fixed Airway Obstruction
Pattern:
Flattened inspiratory AND expiratory limbs
Seen in:
Tracheal stenosis
Endotracheal tube obstruction
Large airway tumor
Clinical interpretation:
Airflow is limited during both inspiration and expiration.
4. Variable Extrathoracic Obstruction
Pattern:
Flattened inspiratory limb
Examples:
Vocal cord dysfunction
Laryngeal edema
Upper airway obstruction
Reason:
Negative intrathoracic pressure during inspiration collapses the airway.
5. Variable Intrathoracic Obstruction
Pattern:
Flattened expiratory limb
Examples:
Tracheomalacia
Intrathoracic airway tumor
Bronchial compression
Reason:
Airways collapse during expiration.

6. Air Trapping / Auto-PEEP
Pattern:
Loop does not return to baseline before next breath
Seen in:
COPD
Asthma
High respiratory rates
Inadequate expiratory time
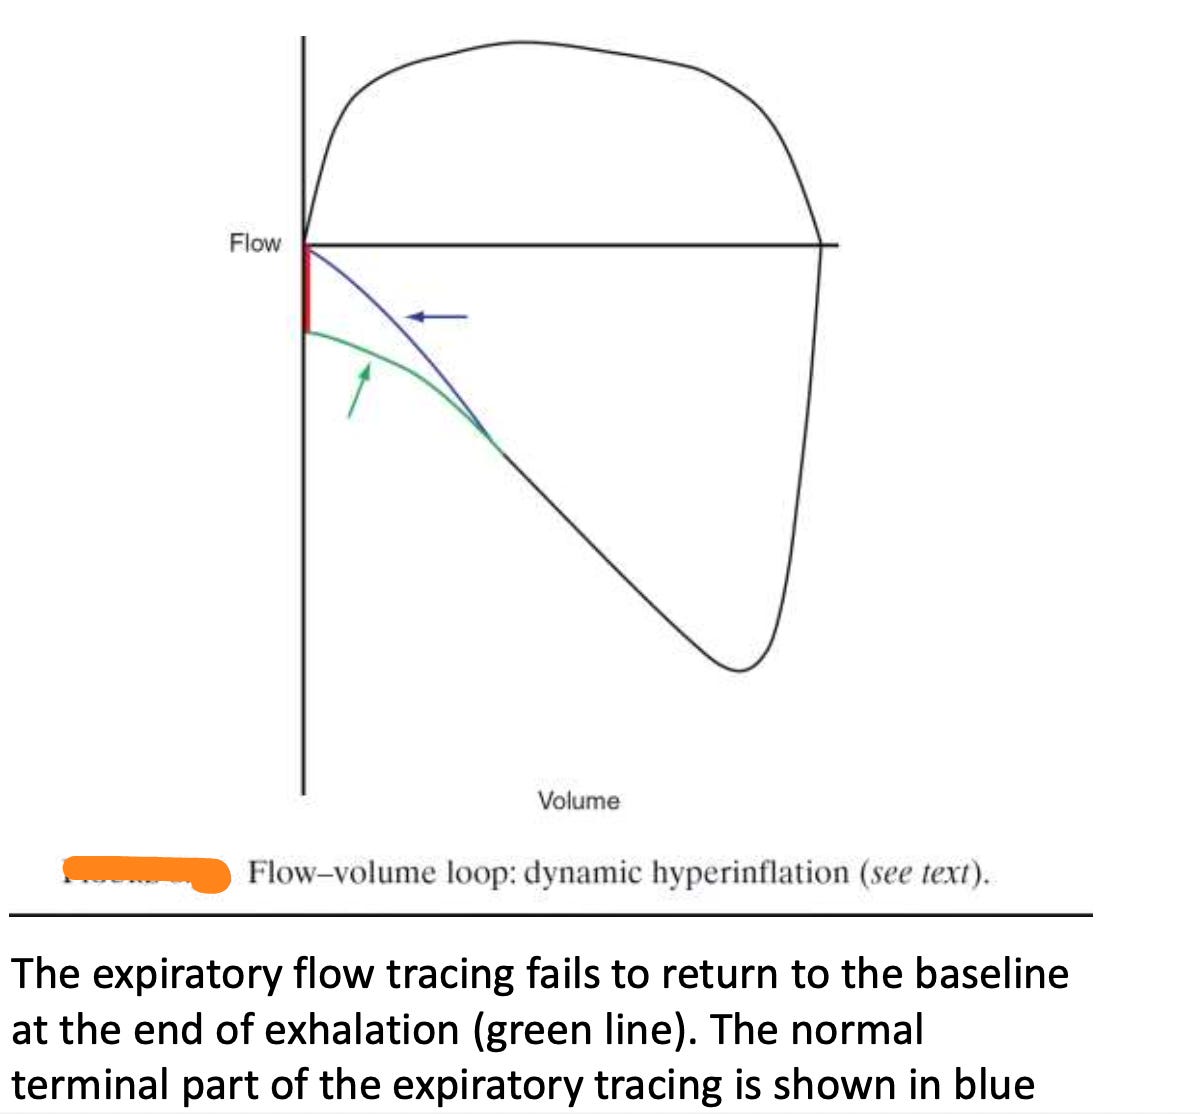
Clinical implications:
Dynamic hyperinflation
Increased work of breathing
Hemodynamic compromise
7. Circuit Leak
Pattern:
Loop fails to close
Inspiratory and expiratory volumes do not match.

Causes:
ETT cuff leak
Circuit disconnection
Bronchopleural fistula
Why Ventilator Loops Matter
Ventilator loops allow clinicians to move beyond simple ventilator settings.
They provide a visual understanding of:
Lung mechanics
Patient–ventilator interaction
Recruitment and overdistension
When combined with waveform analysis, loops help clinicians optimize ventilation and prevent complications such as:
Ventilator-induced lung injury
Dynamic hyperinflation
Patient–ventilator asynchrony
The Takeaway
Ventilator waveforms tell us what is happening over time.
Ventilator loops show how pressure, flow, and volume interact during a breath.
Together, they transform the ventilator screen into a real-time window into respiratory physiology.
For clinicians managing critically ill patients, learning to read ventilator loops is not optional — it is an essential skill.
Creator
Dr Arihant Jain, MD
lifeonthefrontline.com
Follow on Instagram: @humans.of.em